LUNA drops 20% in a day as whale dumps Terra’s UST stablecoin — selloff risks ahead?

Terra (LUNA) has plunged significantly after witnessing a FUD attack on its native stablecoin TerraUSD (UST).
The LUNA/USD pair dropped 20% between May 7 and May 8, hitting $61, its worst level in three months, after a whale mass-dumped $285 million worth of UST. As a result of this selloff, UST briefly lost its U.S. dollar peg, falling to as low as $0.98.
Excessive LUNA supply
LUNA serves as a collateral asset to maintain UST’s dollar peg, according to Terra’s elastic monetary policy. Therefore, when the value of UST is above $1, the Terra protocol incentivizes users to burn LUNA and mint UST. Conversely, when UST’s price drops below $1, the protocol rewards users for burning UST and minting LUNA.
Therefore, during UST supply reduction, LUNA’s valuation should decrease. Similarly, when UST’s supply expands, LUNA’s valuation increases, notes Will Comyns, a researcher at Messari.
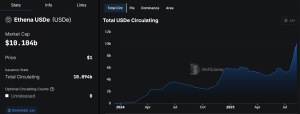
The chart below shows an ongoing downtrend in the daily UST supply, coinciding with a relative increase in daily LUNA supply. On May 8, UST’s market underwent contraction for the first time in two months, dropping by 28.1 million below zero. Simultaneously, LUNA’s supply expanded by over 436.75 million above zero.

The excessive daily supply against what appears to be a lowering or stable market demand may have pushed LUNA’s price lower.
More pain for Terra ahead?
Terra’s ongoing price decline prompted LUNA to retest a support confluence consisting of its 50-day exponential moving average (50-day EMA; the red wave) near $56 and a multi-month upward sloping trendline.
Interestingly, the ascending trendline constitutes a rising wedge pattern in conjugation with another upward trending line above. Rising wedges are bearish reversal setups, so their occurrence on Terra’s weekly chart suggests more downside is probable.

As a rule of technical analysis, a rising wedge breakdown pushes the price lower by as much as the maximum distance between the structure’s upper and lower trendline.
Related: Luna Foundation Guard acquires additional 37,863 BTC as part of reserve strategy
Thus, if LUNA breaks below its wedge from its current support confluence, accompanied by an increase in volumes, its price would risk falling to around $22.50, down over 60% from today’s price.
Conversely, a rebound from the support confluence would have LUNA positioned for a run-up toward the wedge’s upper trendline — above $130, a new record high.
The views and opinions expressed here are solely those of the author and do not necessarily reflect the views of Cointelegraph.com. Every investment and trading move involves risk, you should conduct your own research when making a decision.


