Altcoin Season’s Fate: Analyzing Market Cap Plunge

While the Total Crypto Market Cap (TOTALCAP) has broken out from its corrective pattern, allowing for the possibility of a new yearly high. The Altcoin Market Cap (ALTCAP) invalidated its bullish structure with a sharp fall beginning on June 4.
Even though both have bounced at horizontal support levels, the future outlook looks much more bullish for TOTALCAP. In turn, this puts the possibility of an altseason on hold.
Crypto Market Cap Breaks out From Corrective Channel
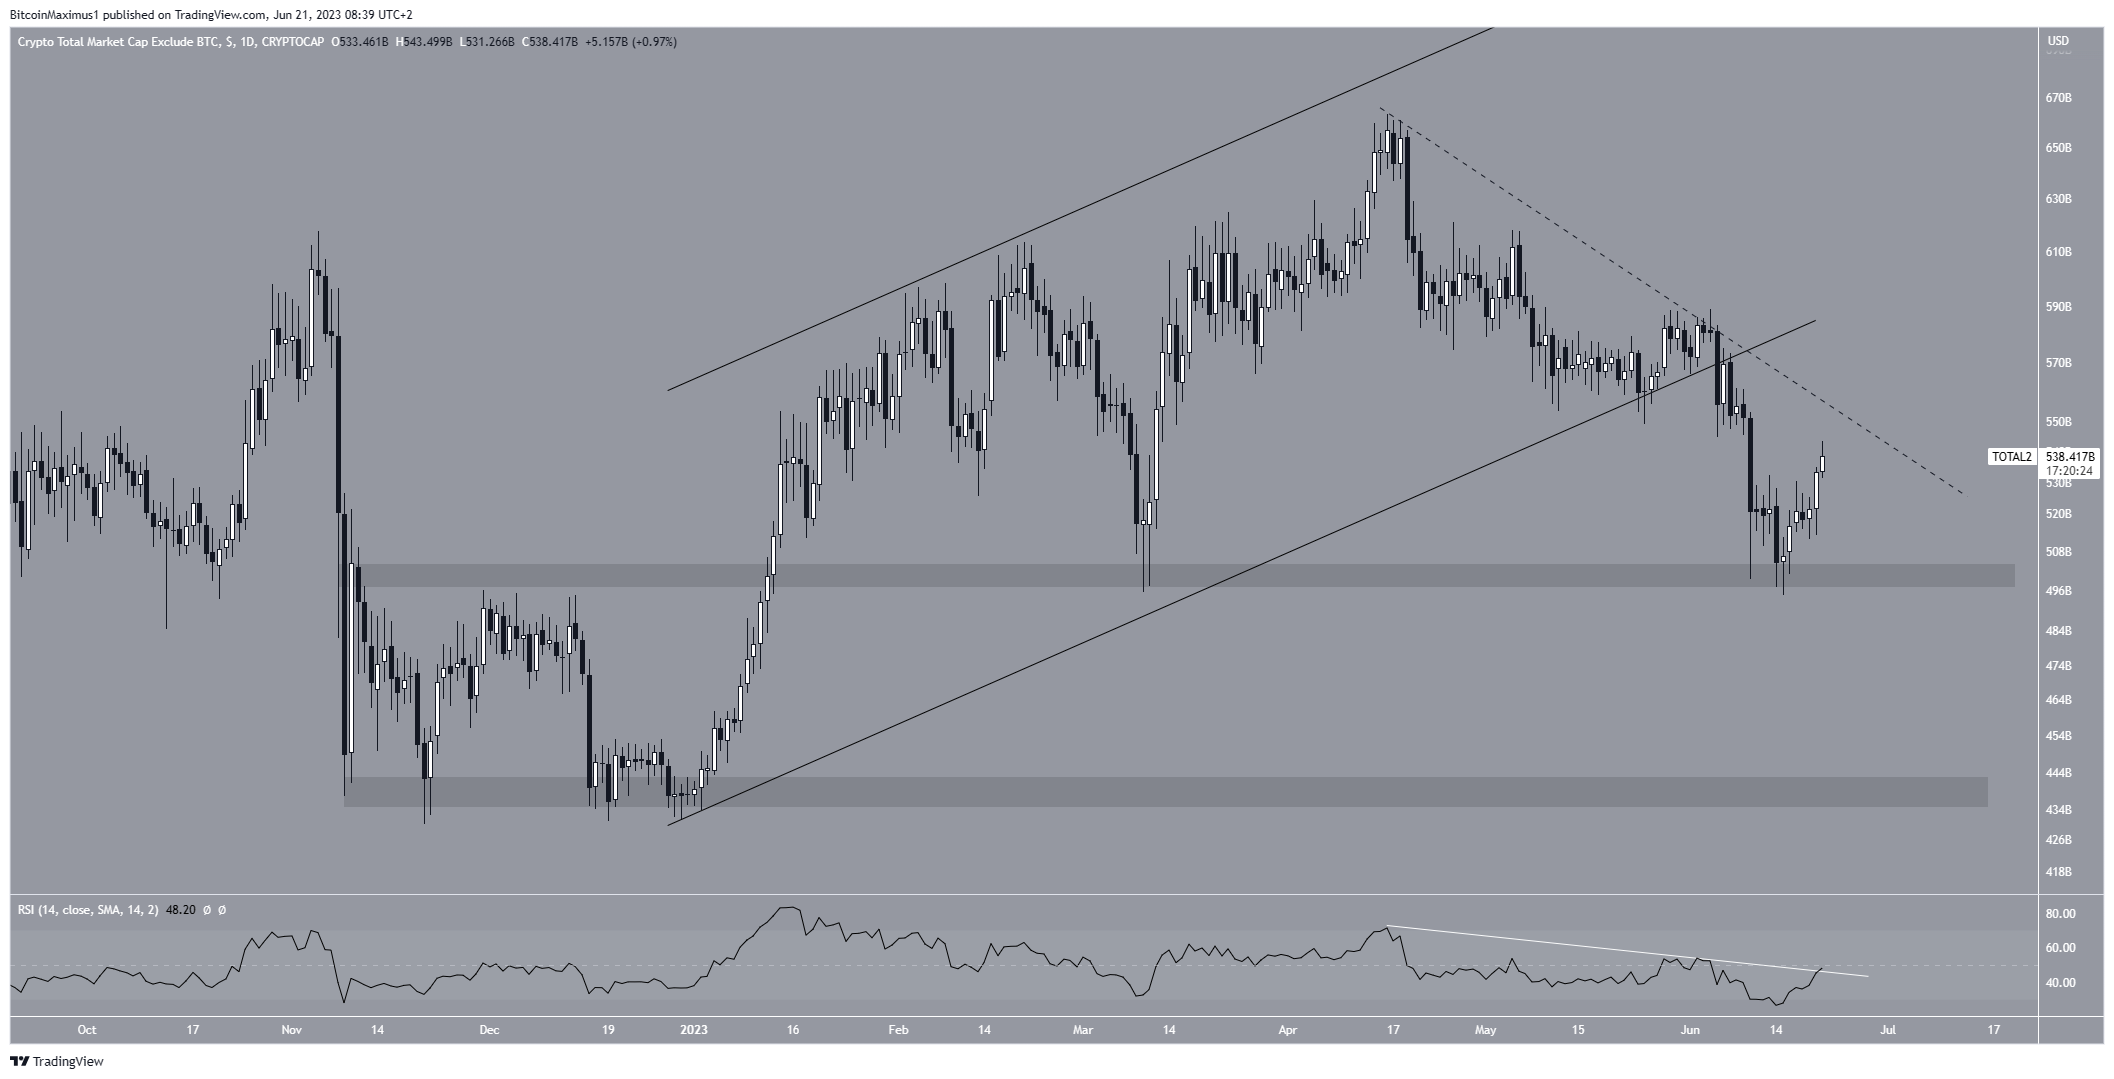
The Total Crypto Market Cap has decreased inside a descending parallel channel since April 15. Such channels usually contain corrective movements, meaning an eventual breakout from the pattern is likely.
Additionally, the considerable overlap inside the pattern further supports the possibility that the drop is corrective.

On June 15, TOTALCAP bounced at the $980 billion support area and began an upward movement toward the channel’s resistance line.
On June 20, TOTALCAP finally broke out from the channel. This means that the correction is complete and an increase to at least $1.15 trillion is likely.
The daily RSI can help in determining the future trend. Traders utilize the RSI as a momentum indicator to assess whether a market is overbought or oversold and to determine whether to accumulate or sell an asset.
If the RSI reading is above 50 and the trend is upward, bulls still have an advantage, but if the reading is below 50, the opposite is true.
The RSI is increasing and has moved above 50. This is a sign of a bullish trend. Moreover, the indicator has broken out from a descending trendline (white) which has been in place as long as the channel.
So, the RSI validates the legitimacy of the breakout and supports continuing the increase.
However, if the price gets rejected from the $1.15 trillion resistance, it could fall to the channel’s resistance line at $1.05 trillion and validate it as support.
Altcoin Season Hopes Crumble as ALTCAP Breaks Down
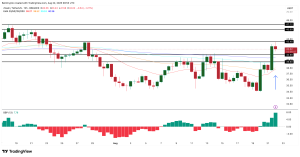
Unlike the Total Market Cap, the technical analysis for the Altcoin Market Cap gives a bearish reading. The main reason for this is the breakdown from a long-term ascending parallel channel, which had been in place since the beginning of the year.
As outlined prior, channels usually contain corrective movements. Since the channel faces upwards, it means that the trend is bearish.
Even though ALTCAP bounced at the $500 billion horizontal support area, the reaction has been weak. Moreover, the daily RSI is below 50 and follows a descending resistance line.
As a result, the most likely future price prediction is a breakdown from the $500 billion support area and a decrease to the next support at $440 billion.
However, if the ALTCAP were to break out from its short-term descending resistance line, this would mean that the trend is still bullish. The price could increase to the closest resistance at $600 billion in that case.
For BeInCrypto’s latest crypto market analysis, click here.
Disclaimer
In line with the Trust Project guidelines, this price analysis article is for informational purposes only and should not be considered financial or investment advice. BeInCrypto is committed to accurate, unbiased reporting, but market conditions are subject to change without notice. Always conduct your own research and consult with a professional before making any financial decisions.