
The 5 Most Bearish Altcoins From Last Week

BeInCrypto looks at the five biggest crypto losers in the entire crypto market this week, specifically from June 30 to July 7.
The underperforming cryptos that saw prices falling the most in the entire cryptocurrency market this week are:
Apecoin (APE) price fell by 22.64%
Fantom (FTM) price fell by 13.89%
Conflux (CFX) price fell by 12.21%
Synthetic (SNX) price fell by 11.50%
Stellar (XLM) price fell by 10.88%
APE Price Leads Bearish Cryptos This Week
The APE price has fallen by 93% since its all-time high of $24.45 on April 28. The decrease culminated with a new all-time low of $1.83 on July 7. This amounted to a drop of 93% from the all-time high.

The daily RSI supports the continuation of the drop. Market traders use the RSI as a momentum indicator to identify overbought or oversold conditions and to decide whether to accumulate or sell an asset.
Readings above 50 and an upward trend indicate that bulls still have an advantage, whereas readings below 50 suggest the opposite. The indicator is below 50 and falling, a sign of a bearish trend.
If APE continues to decrease, the next closest support will be at $1.59. However, if the price initiates a rally, it could move to a short-term descending resistance line currently at $2.50.
Fantom (FTM) Price Falls After Rejection
The FTM price began an upward movement on June 10. During the increase, it made two attempts at breaking out from the $0.32 resistance area. However, they were both unsuccessful, creating successive lower highs (red icons). After the second high, the FTM price fell sharply.
FTM trades just above the 0.618 Fib retracement support level at $0.26. According to the Fibonacci retracement levels theory, following a significant price change in one direction, the price is expected to partially return to a previous price level before continuing in the same direction. The 0.618 Fib level often acts as the bottom if the decrease is corrective.
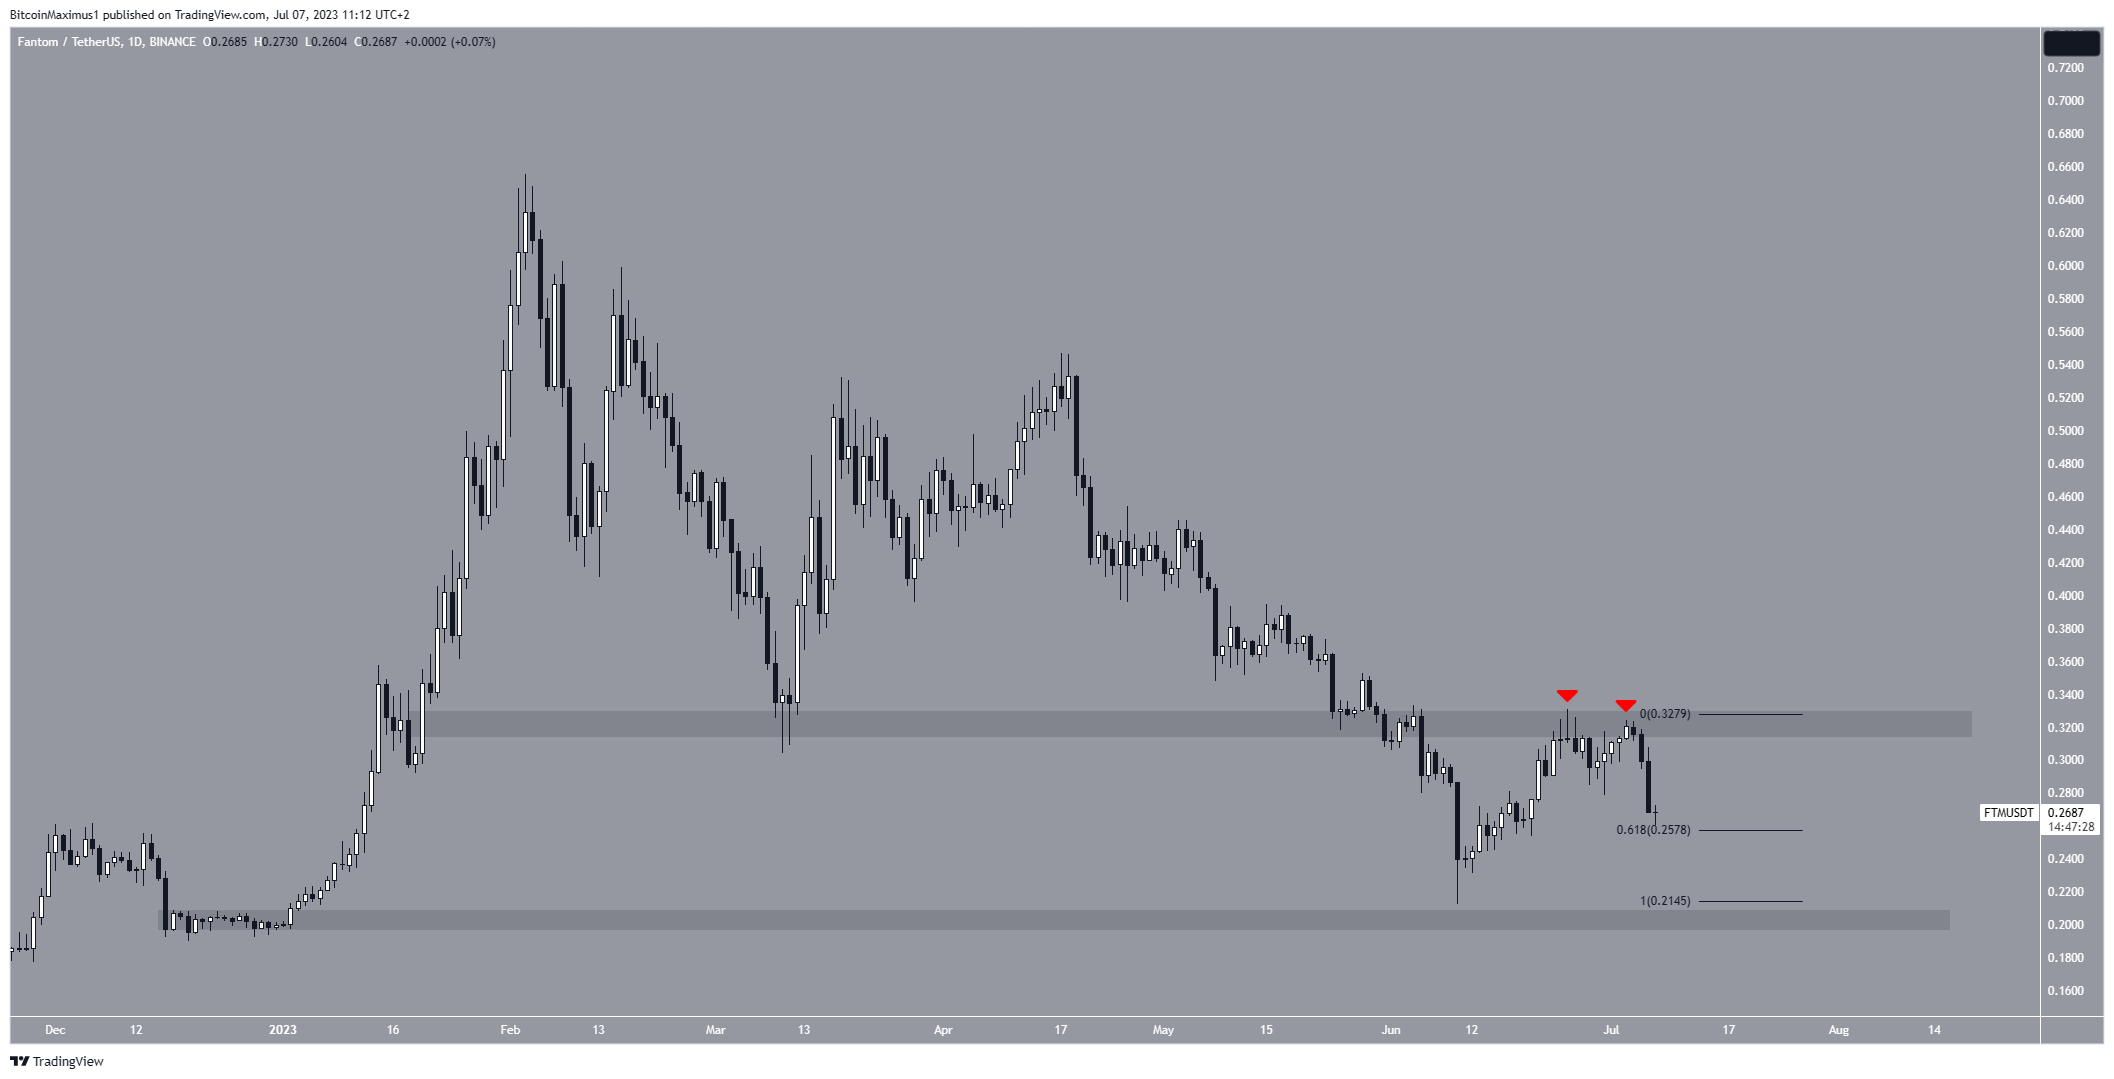
Therefore, if FTM manages to bounce at $0.26, it can make another attempt at breaking out above $0.32. However, if it fails to do so, the price could fall to the next long-term support at $0.20.
Conflux (CFX) Price Fails to Clear Resistance
The CFX price has decreased inside a descending parallel channel since March 13. Such channels usually contain corrective patterns, meaning that an eventual breakout from the channel is the most likely future price scenario.
On June 10, the CFX price bounced at the channel’s support line and began an upward movement toward resistance. However, it was rejected by the channel’s midline (red circle) and has fallen since. This is considered a bearish sign.
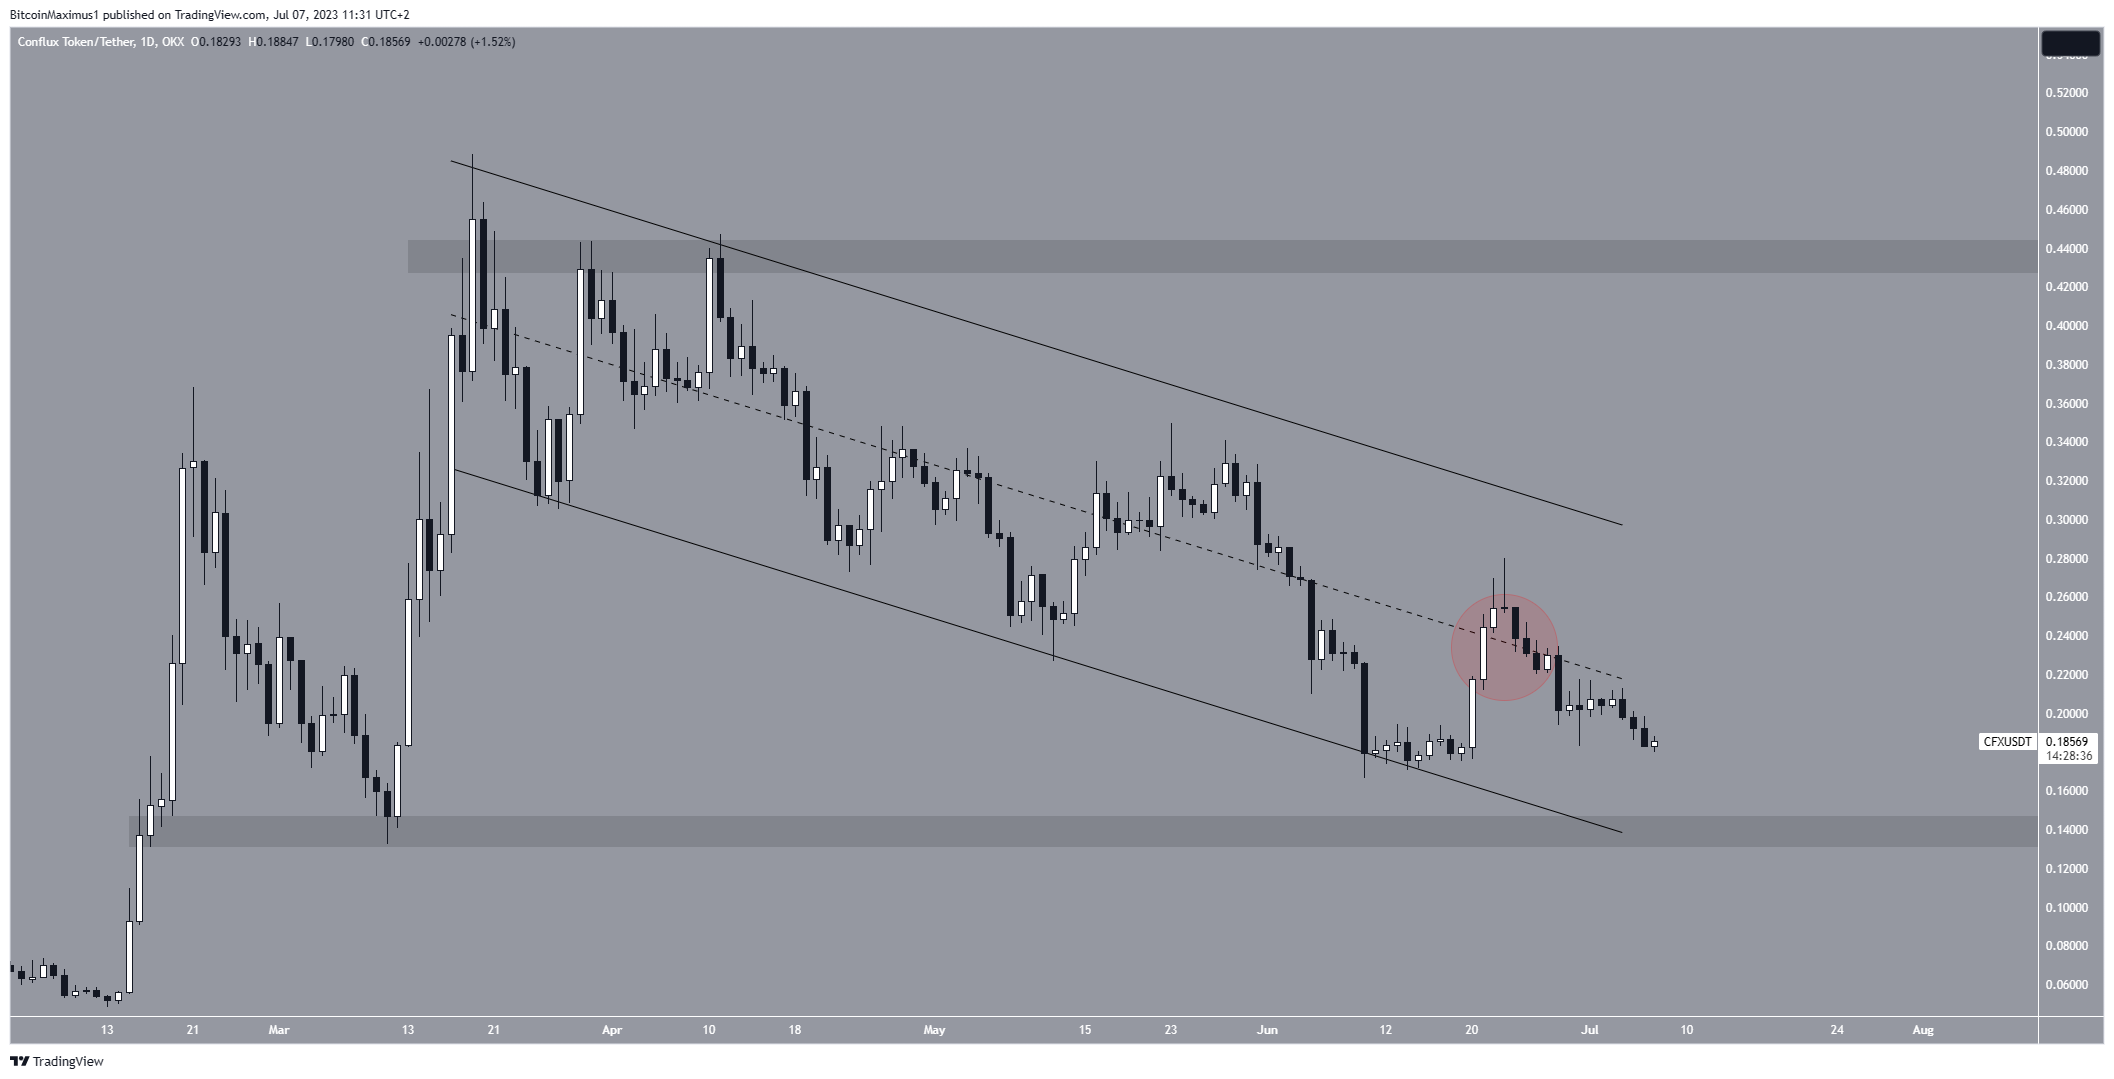
If the decrease continues, CFX can fall to the $0.14 support level created by the channel’s support line and the $0.14 horizontal support area. On the other hand, if CFX moves above the channel’s midline, an increase to its resistance line will be the most likely future price scenario.
Synthetix (SNX) Price Reclaims Key Horizontal Level
The SNX price has increased since June 10. The upward movement was crucial since it caused a reclaim of the $2 horizontal area. Previously, the price had seemingly broken down from the level. However, due to the increase, the previous breakdown is considered only a deviation.
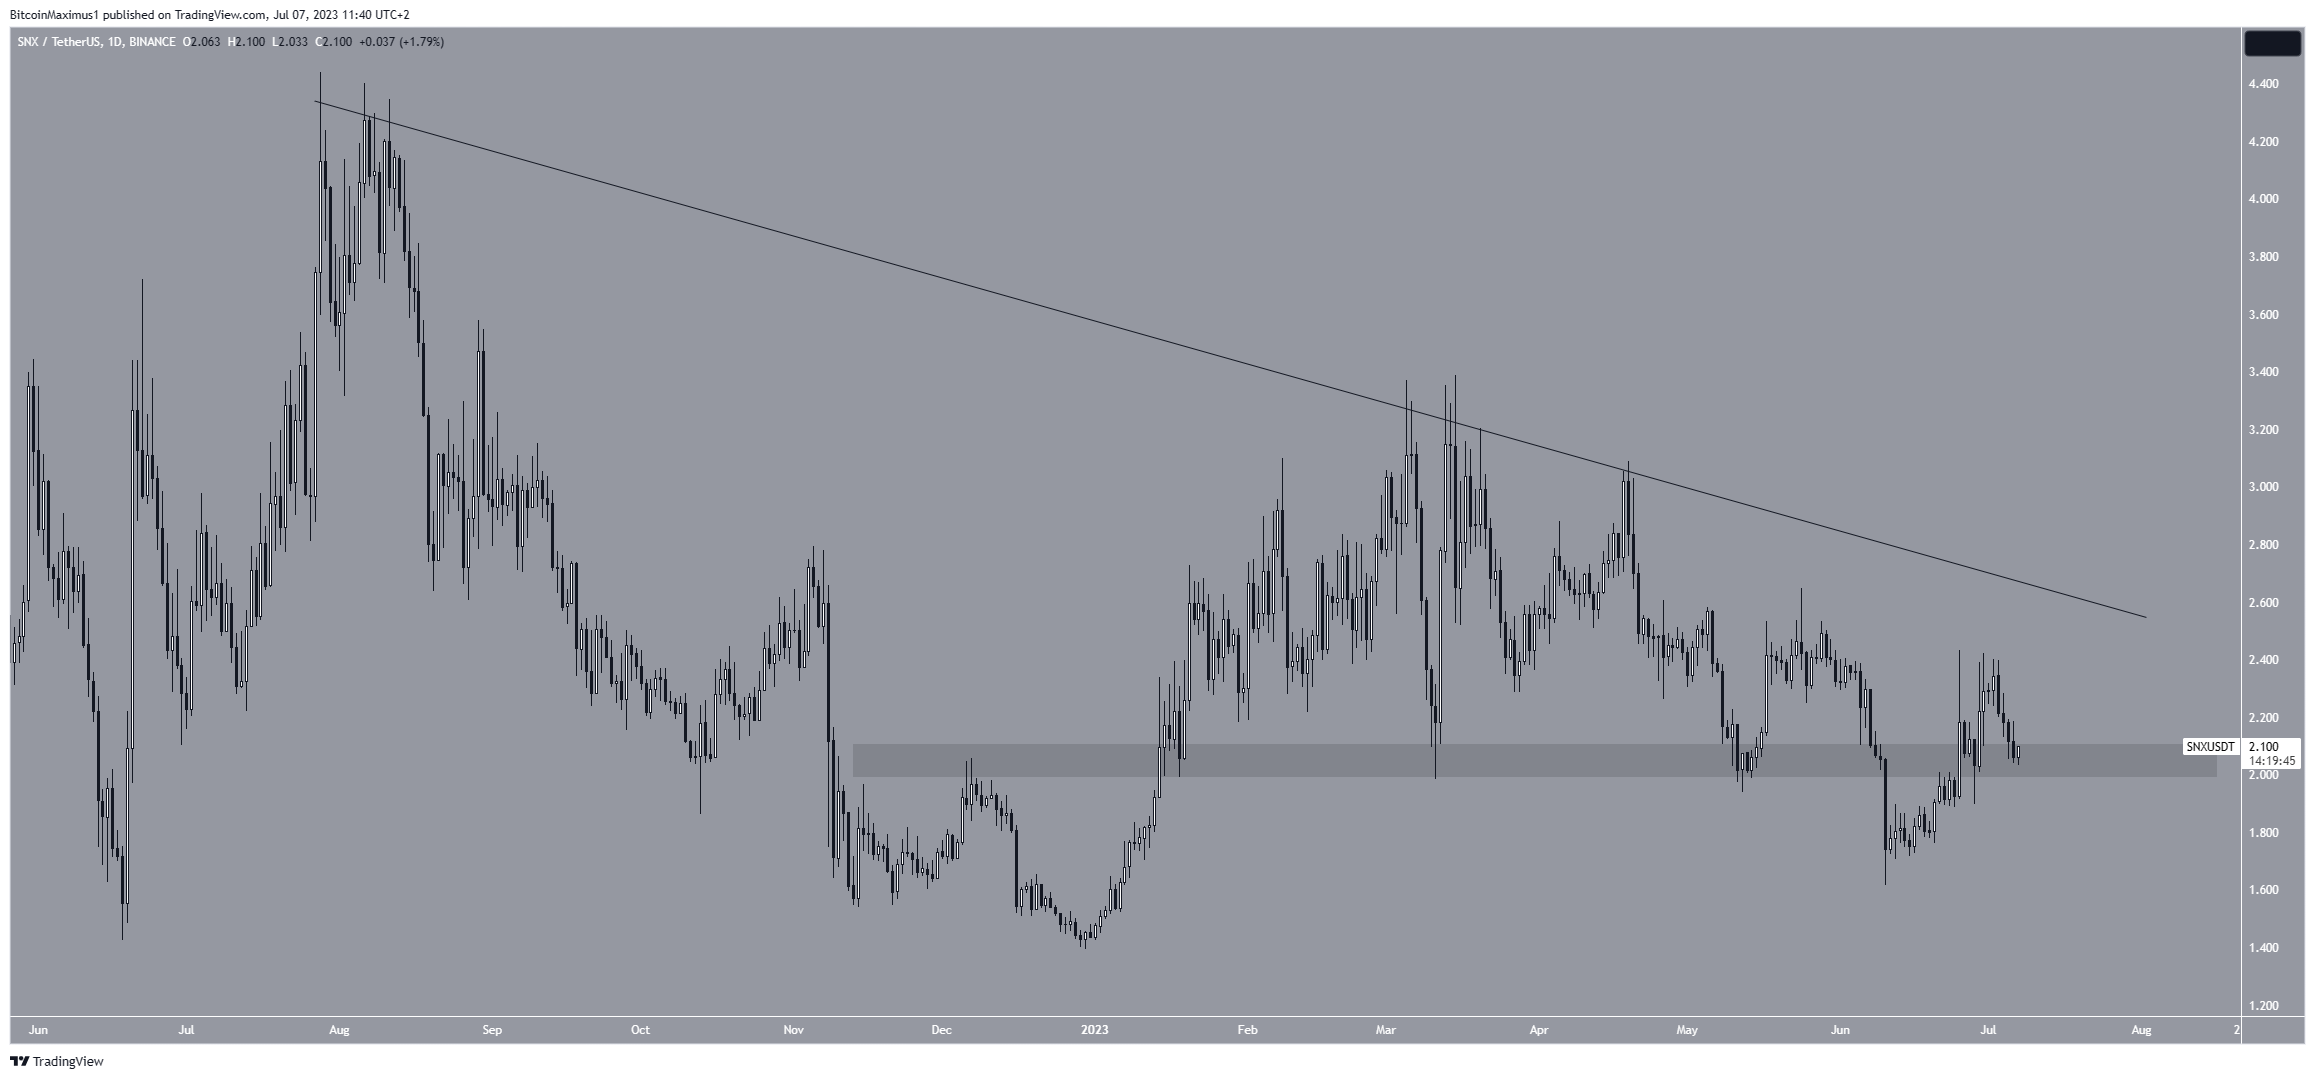
If the increase continues, SNX can move to a long-term descending resistance line at $2.50. However, if the price closes below the $2 area, a drop to the yearly low at $1.30 will likely transpire.
Stellar (XLM) Price Concludes Bearish Cryptos
The Stellar price reached a new yearly high of $0.12 on June 30. However, despite the increase, it failed to break out and close above the $0.11 resistance area. Rather, it created a long upper wick (red icon), considered a sign of selling pressure.
Afterward, the price fell at an accelerated rate and is currently approaching the $0.09 support area.
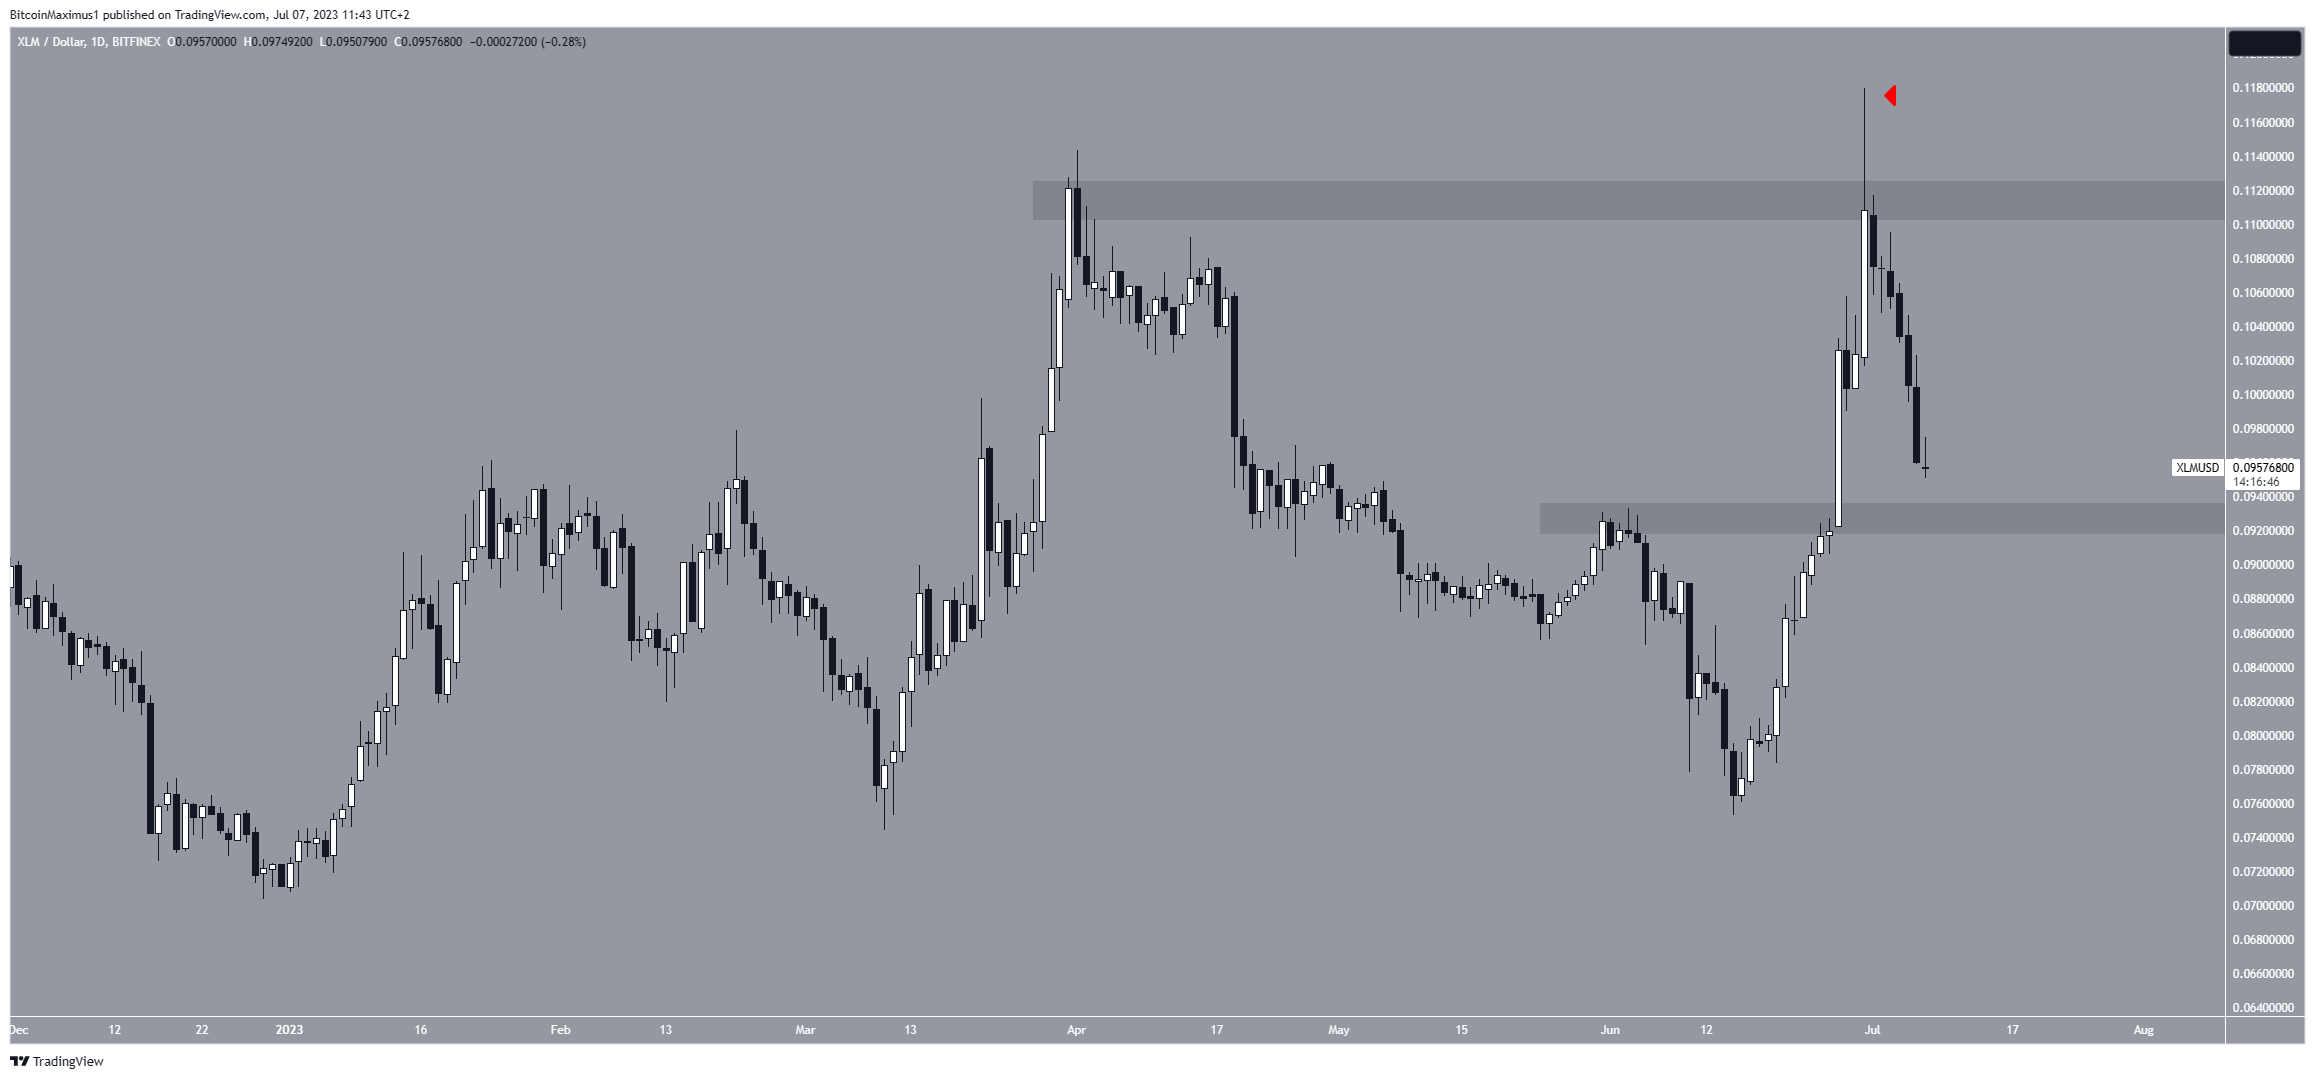
If XLM bounces, it can attempt to break out above $0.11. However, a decrease to the next support at $0.08 will be expected if it breaks down.
For BeInCrypto’s latest crypto market analysis, click here
Disclaimer
In line with the Trust Project guidelines, this price analysis article is for informational purposes only and should not be considered financial or investment advice. BeInCrypto is committed to accurate, unbiased reporting, but market conditions are subject to change without notice. Always conduct your own research and consult with a professional before making any financial decisions.