Polygon (MATIC) Price Prediction: Can it Reclaim $0.60?

The Polygon (MATIC) price broke down from a short-term ascending parallel channel and rapidly approached its yearly lows.
The weekly and daily timeframe analyses both indicate a bearish outlook, implying that further decline is anticipated prior to the eventual bullish trend reversal.
Polygon Price Approaches Yearly Low
The weekly timeframe technical analysis for MATIC gives a decisively bearish outlook. There are two main reasons for this.
Firstly, the price broke down (red circle) from an ascending parallel channel in April. Before the breakdown, the channel had been in place since July 2022. Since channels usually contain corrective movements, the entire increase since July 2022 was corrective, and the trend is now bearish.

Sponsored
Sponsored
This possibility was further strengthened by the MATIC price falling below the $0.80 horizontal area. It then validated it as resistance (red icon), creating a long upper wick, considered a sign of selling pressure.
If the decrease continues, the MATIC price can fall to the $0.40 support area, a 30% decrease measuring from the current price.
Furthermore, the weekly Relative Strength Index (RSI) indicates a pessimistic outlook. The RSI, a tool traders use to assess whether a market is excessively bought or sold, aids in determining whether to buy or sell an asset.
A reading above 50 on the RSI and an upward trajectory align with a bullish view, signifying a favorable market sentiment. Conversely, a reading below 50 suggests a bearish sentiment, favoring sellers, as demonstrated when the RSI drops below this threshold. Currently, the RSI is below 50 and decreasing, highlighting a bearish trend.
MATIC Price Prediction: Failed Breakout Can Lead to More Downside
The daily analysis for MATIC is also bearish. The main reason for this is the failed breakout from a descending resistance line on July 10.
The breakout could not be sustained, and the price reversed the trend three days later. Currently, MATIC trades slightly below the minor $0.60 support area, well below the breakout level.
If the MATIC price breaks down below $0.60, it will confirm that it is headed to long-term support at $0.40. This will also lead to a new yearly low.
The daily RSI supports the breakdown and ensuing decrease. The indicator is below 50 and falling, both signs of a bearish trend.
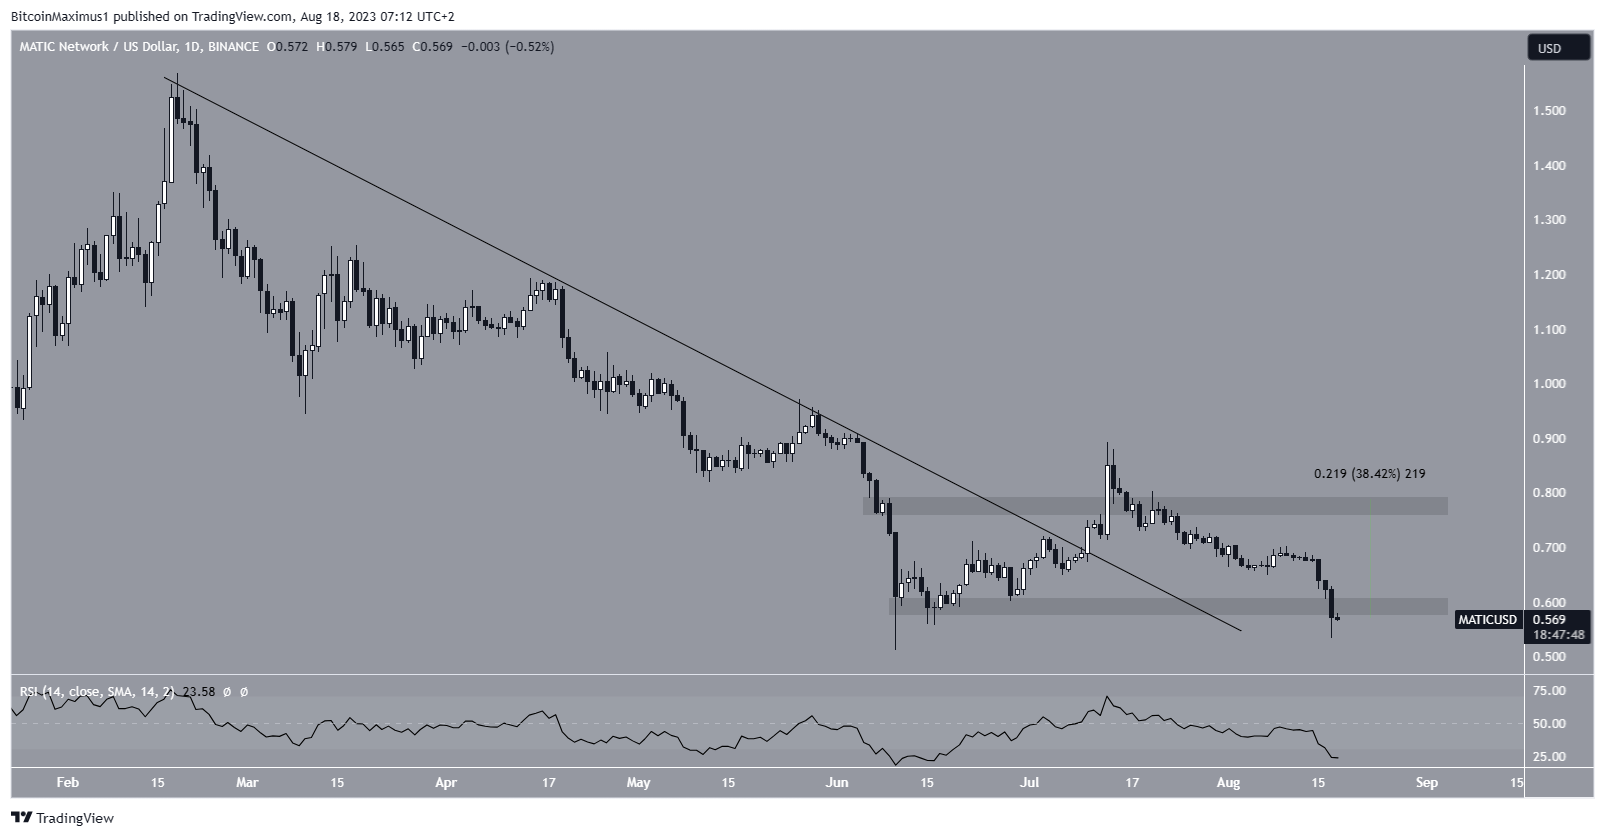
Despite this bearish MATIC price prediction, a strong bounce and reclaim of the $0.60 support area can lead to a 38% increase to the next resistance at $0.80. However, there are no imminent signs that suggest this bounce will occur.
For BeInCrypto’s latest crypto market analysis, click here.
Disclaimer
In line with the Trust Project guidelines, this price analysis article is for informational purposes only and should not be considered financial or investment advice. BeInCrypto is committed to accurate, unbiased reporting, but market conditions are subject to change without notice. Always conduct your own research and consult with a professional before making any financial decisions.