
Bitcoin (BTC) Bounces Back After Rapid Drop to $60,000
Bitcoin (BTC) is still in the process of trying to break out above the $63,530 resistance area. Doing so would likely lead to a new all-time high price.
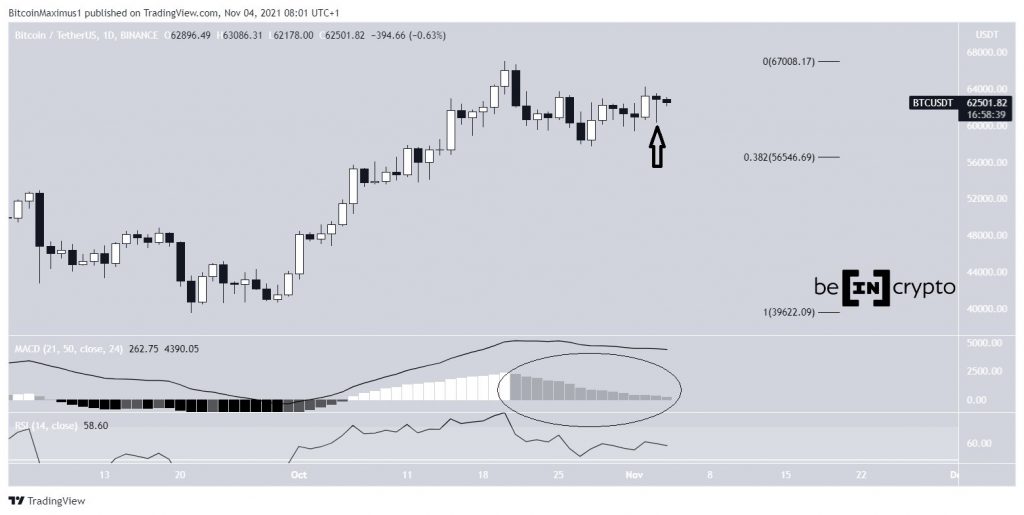
BTC decreased considerably in the early hours of Nov 3, falling to a low of $60,382. However, it rebounded shortly after and created a long lower wick (black arrow). This is considered a sign of buying pressure since the lower prices could not be sustained. It is a bullish occurrence.
Technical indicators still provide mixed readings.
The MACD, which is created by short and long-term moving averages (MA), has created 14 successive lower histogram bars (black circle). This conveys that the short-term MA is gradually decelerating.

However, the RSI, which is a momentum indicator, has seemingly bounced above 50 after a continued fall. This is a sign that momentum is still bullish.
Therefore, while the price action in the daily time frame is bullish, technical indicators are mixed.
Future movement
The six-hour chart shows that BTC broke out from a descending parallel channel and validated it as support after. This indicated that the correction phase that’s been in place since the all-time high was complete.
Since then, BTC has been following an ascending support line (dashed). Yesterday’s bounce coincided with both the support line (green icon) and the 0.618 Fib retracement support level at $61,270 (black).
The main resistance area is found at $63,530. This is both a horizontal resistance area and the 0.618 Fib retracement resistance level (white).
A breakout above this level would likely cause the price to quickly move upwards.
BTC wave count
The wave count suggests that BTC is in sub-wave five (black) of wave one (orange). This means that BTC will likely increase once more prior to correcting in the short term.
A target for a local top is found near $73,000. This target is found by using the 1.61 external Fib retracement on sub-wave four (black) and projection of waves 1-3 (white).
The other possibility would suggest that BTC is in a 1-2/1-2 wave formation. In this case, it’s currently in wave three, which would mean that the increase could accelerate rapidly. In this possibility, BTC could go well into a new all-time high before another corrective phase.
Both possibilities indicate that BTC is likely to increase to a new all-time high and remains in a long-term bullish trend.
For BeInCrypto’s previous Bitcoin (BTC) analysis, click here.
Disclaimer
All the information contained on our website is published in good faith and for general information purposes only. Any action the reader takes upon the information found on our website is strictly at their own risk.