Bitcoin (BTC) Price Regains Momentum, Targets $24,500

The Bitcoin (BTC) price retraced a portion of the previous increase but has regained its strength and could make an attempt at moving toward $24,500.
The weekly Bitcoin price outlook is decisively bullish. There are several reasons for this. First, the price broke out from a long-term descending resistance line, which had been in place since the all-time high. Afterward, it validated it as support (green icon).
Next, the BTC price began an upward movement and reclaimed the $19,300 horizontal area. This is a crucial area since it acted as the all-time high in 2017. Then, it turned to support in June 2022. Its reclaim is a bullish development since it renders the previous breakdown as illegitimate (red circle).
Lastly, the weekly RSI generated bullish divergence (green line). This is a sign that often precedes long-term bullish trend reversals. In the weekly time frame, the main resistance area is at $32,000. However, there are several short-term resistance levels before $32,000.
If the BTC price closest below $19,300, it would indicate that the trend is still bearish. In that case, new lows would be expected.
Bitcoin Retraces After Sharp Increase
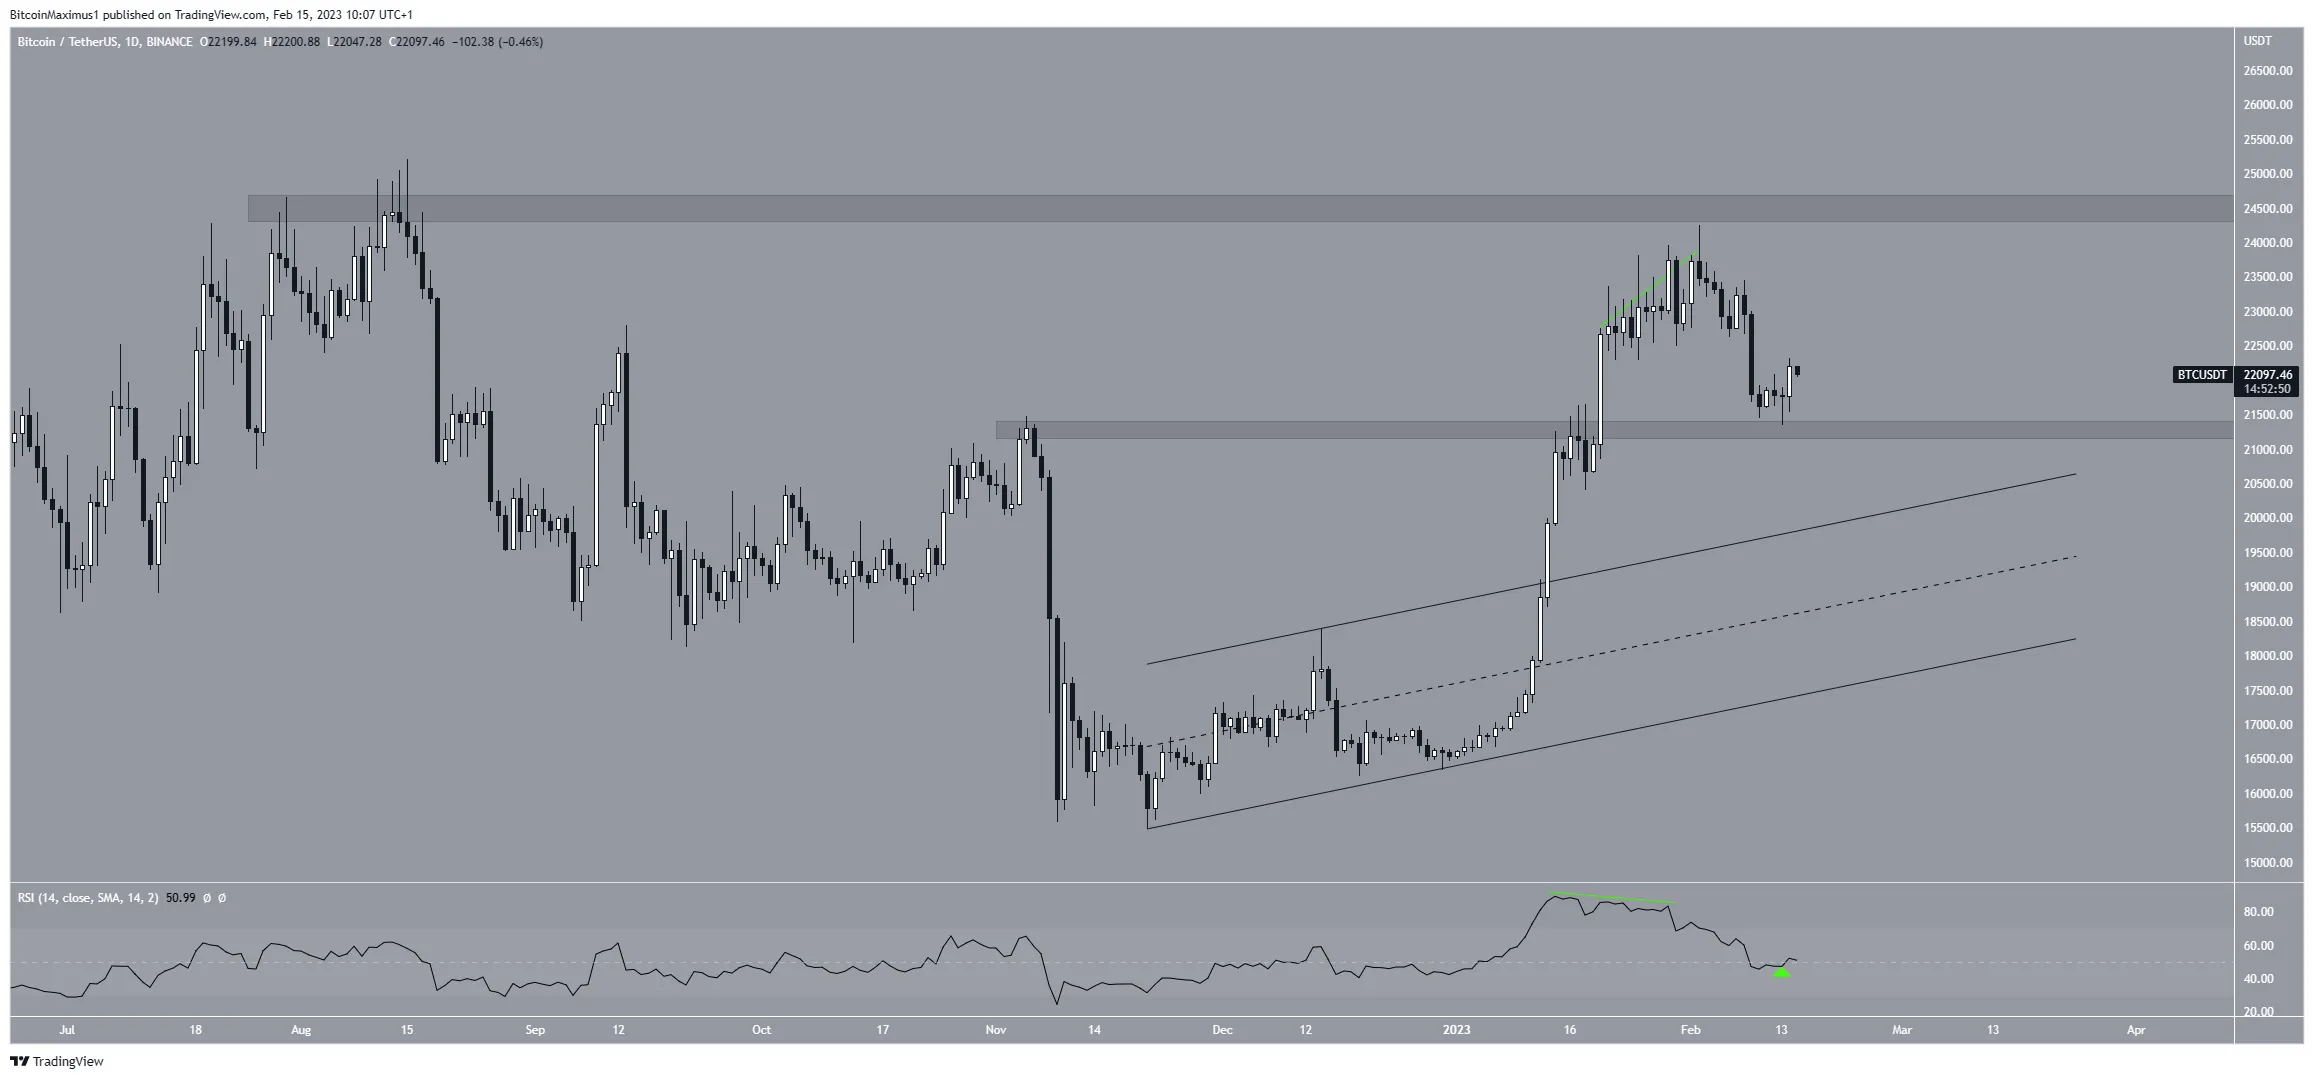
While the outlook from the weekly time frame is decisively bullish, the daily one gives a more mixed reading. While the price broke out from an ascending parallel channel, it lost momentum near the end of Jan., and the RSI generated bearish divergence.
The trend reversed on Feb. 2, and the Bitcoin price has fallen since. More importantly, the BTC price has not broken out above the $24,500 resistance area. This is the main resistance before the aforementioned long-term resistance at $32,000.
The daily RSI is at 50, a sign of a neutral trend.
So, whether the Bitcoin price breaks out above $24,500 or breaks down below $21,200 will determine the future trend’s direction. A breakout could take the price to $32,000, while a breakdown could cause it to fall toward $19,500.

Wave Count Supports Increase
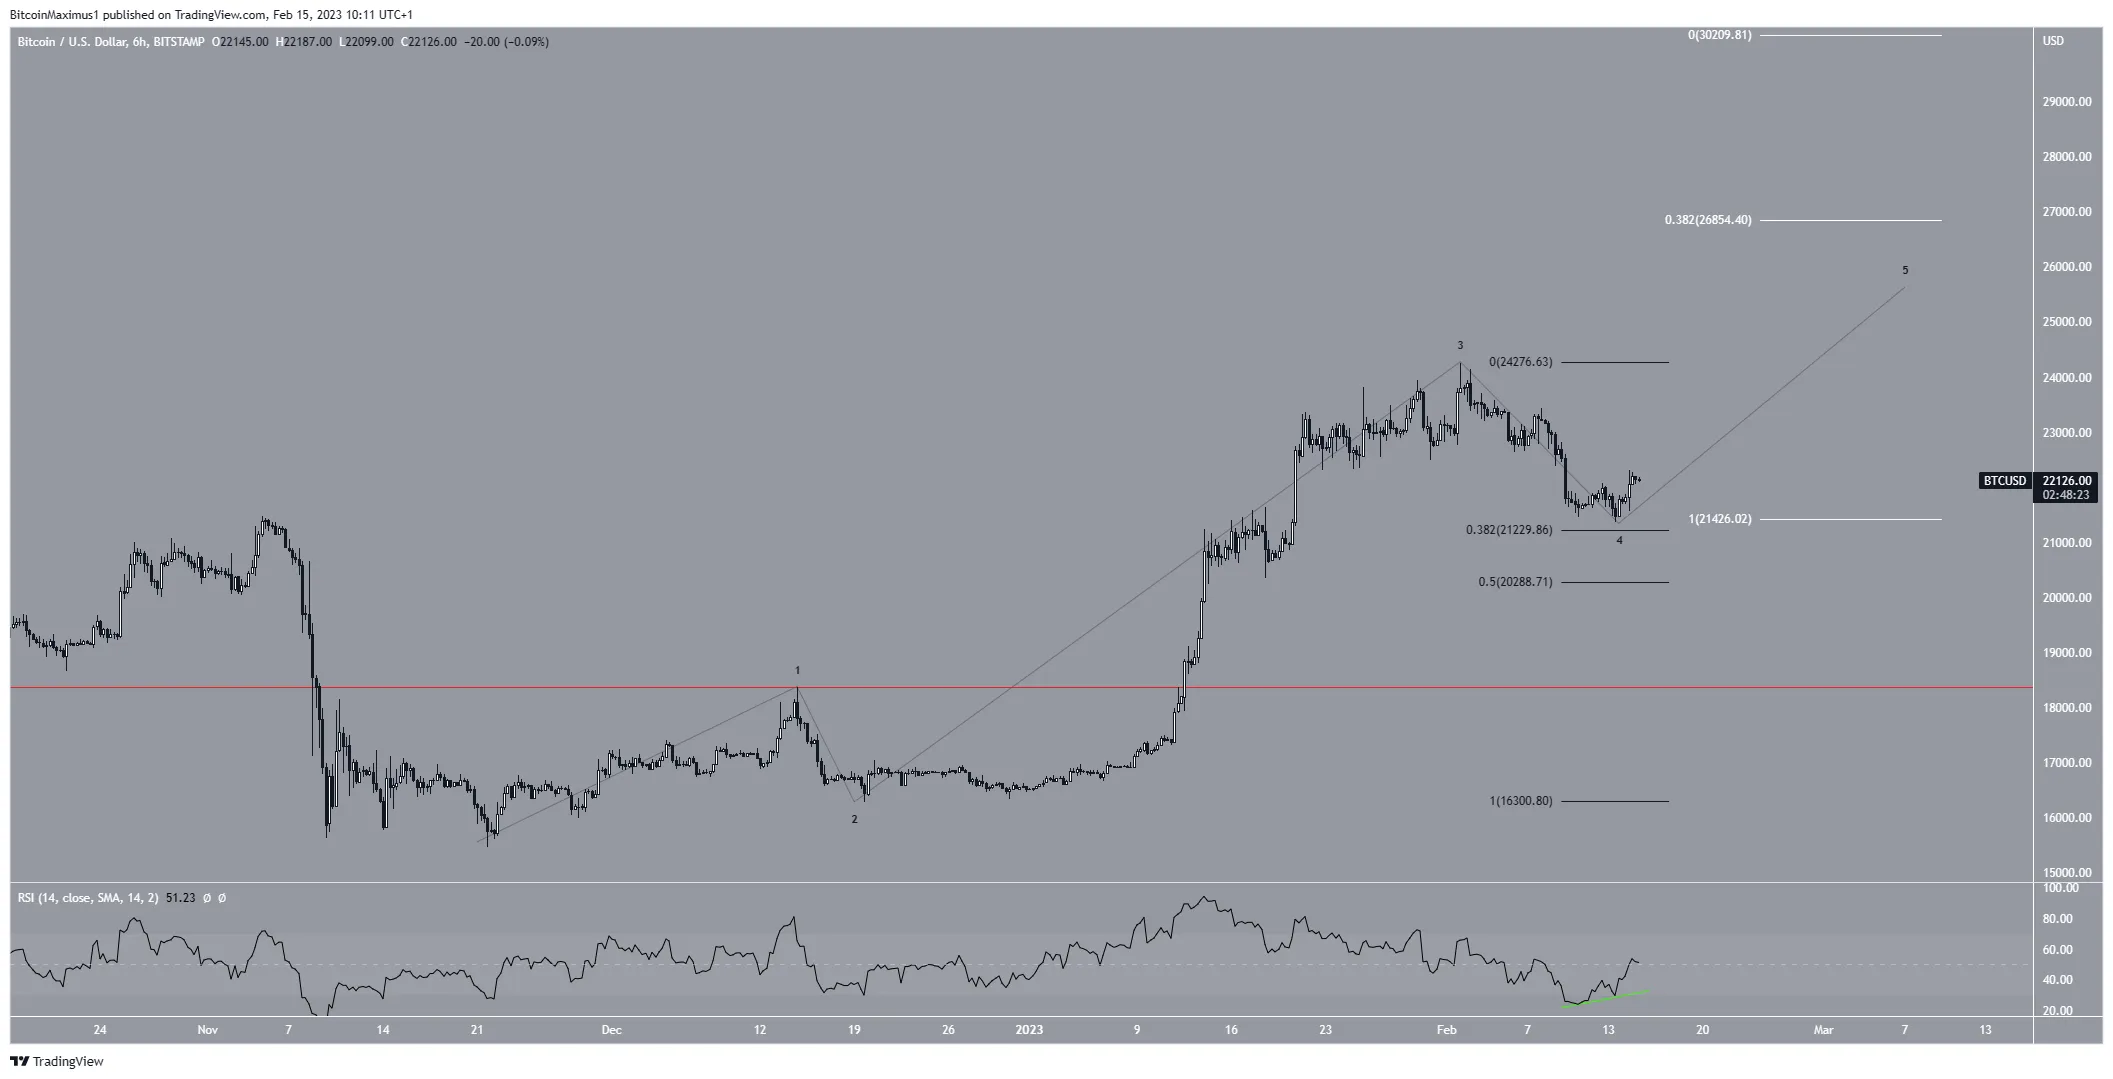
Finally, the short-term six-hour chart supports the possibility of an increase. The reasons for this are the bullish divergence in the RSI (green line) and the wave count.
The wave count suggests that the digital asset is in wave four of a five-wave increase. The two main targets for the top of wave five are at $26,845 and $30,200. They are found by using an extension on waves one and three (white).
However, it is unclear whether wave four has ended or the Bitcoin price will decrease to the 0.5 Fib retracement support level at $20,288. If the latter occurs, it will also cause the targets to decrease slightly. If a breakdown occurs, the targets could be reached in 24 hours.
Furthermore, a fall below the wave one high (red line) at $18,400 would invalidate the entire bullish forecast and send the BTC price toward $15,000.

To conclude, the most likely Bitcoin price forecast is an increase toward $24,500 and a potential breakout. On the other hand, a close below $21,200 could trigger a sharp fall to $20,280 and possibly lower.
For BeInCrypto’s latest crypto market analysis, click here.
Disclaimer
BeInCrypto strives to provide accurate and up-to-date information, but it will not be responsible for any missing facts or inaccurate information. You comply and understand that you should use any of this information at your own risk. Cryptocurrencies are highly volatile financial assets, so research and make your own financial decisions.


