BTC Loses Support Below $19,000

The Bitcoin price prediction shows that BTC is falling below the moving averages as it trades at the $19,287level.
Bitcoin Prediction Statistics Data:
Bitcoin price now – $19,287
Bitcoin market cap – $638.0 billion
Bitcoin circulating supply – 19.0 million
Bitcoin total supply – 19.0 million
Bitcoin Coinmarketcap ranking – #1
BTC/USD Long-term Trend: Bearish (Daily Chart)
Key levels:
Resistance Levels: $25,000, $27,000, $29,000
Support Levels: $15,000, $13,000, $11,000
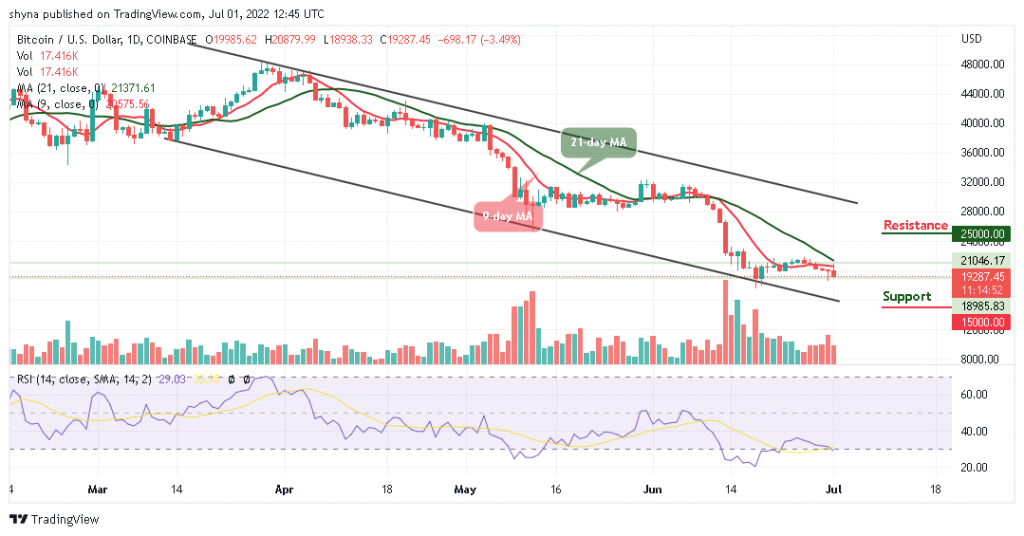
The daily chart reveals that BTC/USD will likely claim more support as the king coin moves within the descending channel with the current consolidation pattern. More so, as the coin fails to cross above the 9-day and 21-day moving averages, BTC/USD may likely see a sharp drop below the lower boundary of the channel. Similarly, the first level of support may be located at $18,000. Beneath this, other supports lie at $15,000, $13,000, and $11,000.
Bitcoin Price Prediction: Bitcoin (BTC) May Not Head to the Upside Now
As the daily chart reveals, the Bitcoin price has failed to break above the resistance level at $20,000, the king coin may set up another few days of negative price declines beneath $19,000. A break above the previous level would have set Bitcoin up to retest the $21,000 level. Meanwhile, the technical indicator Relative Strength Index (14) may move sideways.
Moreover, traders can see that the Bitcoin price remains below the 9-day moving average, sliding towards the lower boundary of the channel may gain more downtrends. Today, the Bitcoin price touches $20,879 but now dropping beneath the support level of $19,500. However, it does look that bears may end up closing below this support. More so, if the coin moves toward the upside, resistance levels could be located at $25,000, $27,000, and $29,000.
BTC/USD Medium-Term Trend: Ranging (4H Chart)
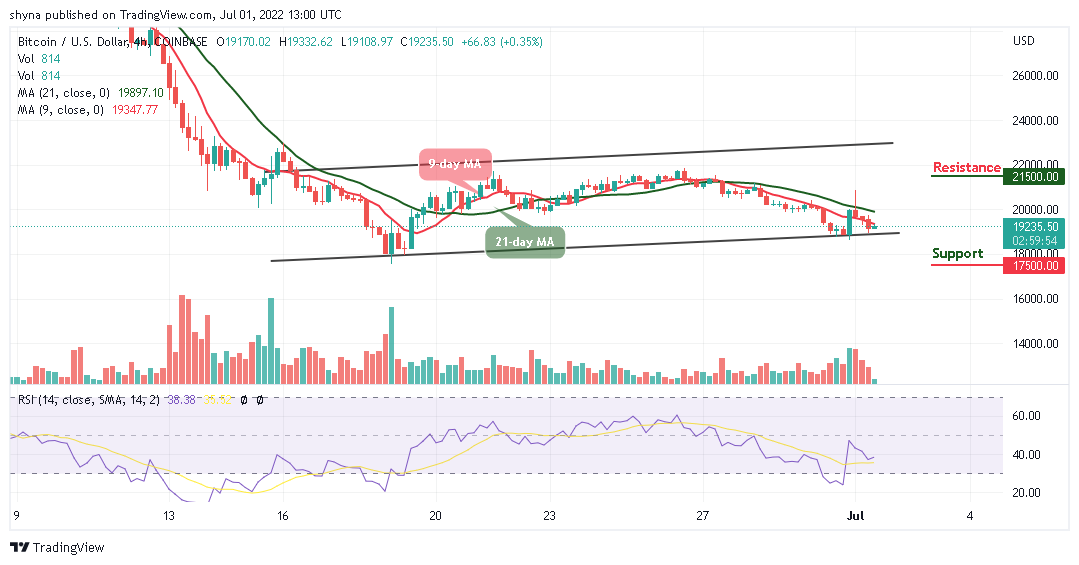
The 4-hour chart shows that the Bitcoin bulls are likely to step back into the market by pushing the BTC price to cross above the 9-day and 21-day moving averages. Although the Bitcoin price has not yet slipped below $19,000 in the last few hours, it’s still in the loop of making a bounce back.

At the moment, BTC/USD is currently moving below the moving averages. The upward movement may likely push the price nearest resistance at $21,500 and above while the immediate support lies at $17,500 and below. The technical indicator Relative Strength Index (14) is moving to cross above the 40-level, suggesting that the market may head to the north.
eToro – Our Recommended Bitcoin Platform
Regulated by the FCA, ASIC and CySEC
Buy Bitcoin with Bank transfer, Credit card, Neteller, Paypal, Skrill
Free Demo Account, Social Trading Community – 20 Million Users
Free Bitcoin Wallet – Unlosable Private Key
Copytrade Winning Bitcoin Traders – 83.7% Average Yearly Profit
68% of retail investor accounts lose money when trading CFDs with this provider.
Read more:


