BTC/USD Approaches New Support at $46,000

Bitcoin Price Prediction – December 13
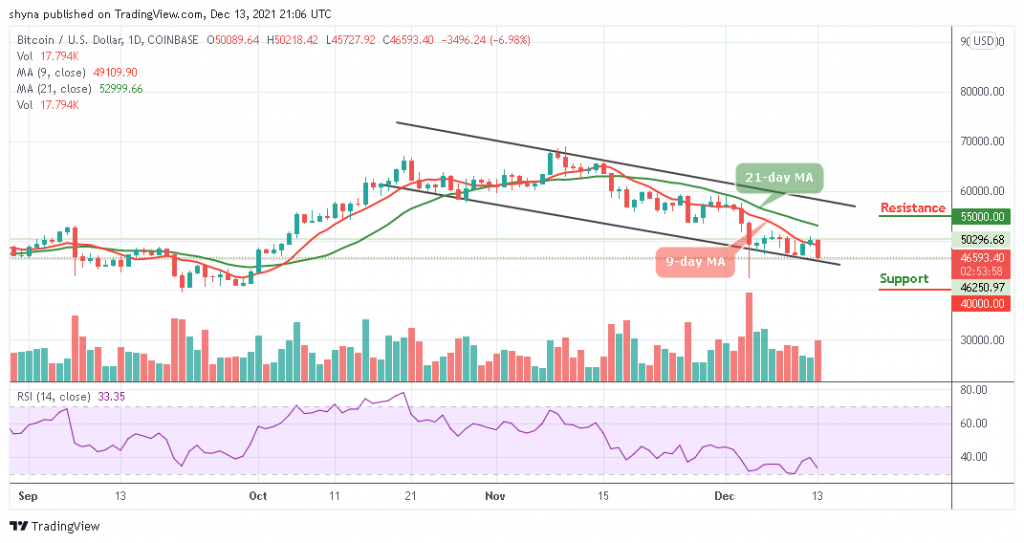
The Bitcoin price prediction is now showing signs of market correction as its price plans to move below $46,500.
BTC/USD Long-term Trend: Bearish (Daily Chart)
Key levels:
Resistance Levels: $55,000, $57,000, $59,000
Support Levels: $40,000, $38,000, $36,000
BTC/USD is currently trading below the $47,000 level as the price aims to cross below the lower boundary of the channel. However, the bearish drive could be coming to an end if the technical indicator makes a quick bounce back above the 9-day moving average and face the resistance level of $50,000.
Bitcoin Price Prediction: Bitcoin (BTC) May Slide to $45k Support
At the time of writing, the Bitcoin price is changing hands at $46,593 which marks a significant rally below the moving averages. However, BTC/USD keeps obeying the bearish movement as the sellers may close today’s candle below the lower boundary of the channel. However, should in case this comes to play, the Bitcoin price may remain within the negative side. Looking at the daily chart, BTC/USD may fall below $45,000 support and it could later move towards the critical support levels of $40,000, $38,000, and $36,000.
On the other hand, if the Bitcoin price failed to close below the $46,000 level; the price may faces and cross above the 9-day and 21-day moving averages. More so, crossing above this barrier may send the coin to the resistance levels of $55,000, $57,000, and $59,000. However, the technical indicator Relative Strength Index (14) recently reveals a sign of trend reversal, which shows a possible bearish momentum in the market soon.

BTC/USD Medium – Term Trend: Ranging (4H Chart)
On the 4-hour chart, BTC/USD is currently trading around $46,559 near the lower boundary of the channel heading towards the support level of $46,260 where the market touched today as the Bitcoin price remains at the downside.

However, if buyers could energize the market, they can further push the price above the 9-day and 21-day moving averages and this could make the coin to hit the resistance level of $49,000 and above. Therefore, the technical indicator Relative Strength Index (14) is likely to move into the oversold region and any further bearish movement to the south may locate the support level of $44,500 and below.
Looking to buy or trade Bitcoin (BTC) now? Invest at eToro!
68% of retail investor accounts lose money when trading CFDs with this provider
Read more:


