BTC/USD Starts Technical Correction as Price Hits $17k

Join Our Telegram channel to stay up to date on breaking news coverage
The Bitcoin price prediction reveals that BTC is retracing its recent losses, and it’s correcting gains and might decline towards the $16,500 support.
Bitcoin Prediction Statistics Data:
Bitcoin price now – $16,906
Bitcoin market cap – $325.5 billion
Bitcoin circulating supply – 19.2 million
Bitcoin total supply – 19.2 million
Bitcoin Coinmarketcap ranking – #1
BTC/USD Long-term Trend: Ranging (Daily Chart)
Key levels:
Resistance Levels: $20,000, $22,000, $24,000
Support Levels: $15,000, $13,000, $11,000
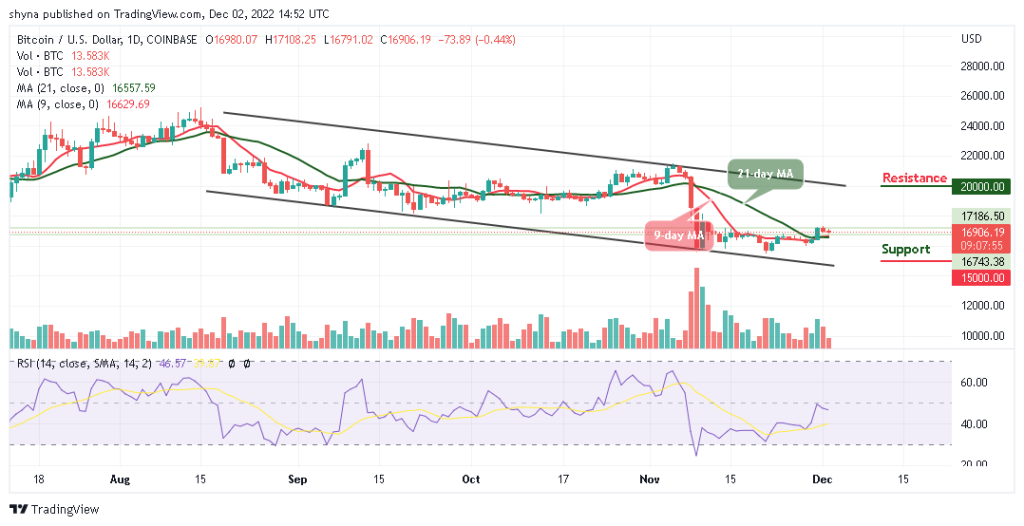
BTC/USD begins a steady increase above the resistance level of $17,000 as the king coin touches the daily high at $17,108 level and settled above the 9-day and 21-day moving averages. The bulls may continue to find some resistance levels above moving averages on the road to recovery and the path of least resistance appears to the upside in the near term amid a favorable bullish technical setup.
Bitcoin Price Prediction: BTC Price Could Face Bulls
The Bitcoin price touches the daily low at $16,791.02, which is below the opening price of today. The king coin is likely to face the resistance level of $18,000 by looking forward to reclaiming the resistance level of $17,000. Besides, there was a break below a major bullish trend line with support near $16,750 on the daily chart of the BTC/USD pair. Nevertheless, the Bitcoin price is still hovering above $16,650 and the 9-day and 21-day moving averages.
Meanwhile, the technical indicator Relative Strength Index (14) is moving below the 50-level, indicating a bearish movement. Therefore, if the Bitcoin price faces the upper boundary of the channel, it could hit the resistance levels of $20,000, $22,000, and $24,000, but any movement below the moving averages could hit the supports at $15,000, $13,000, and $11,000.
BTC/USD Medium-term Trend: Ranging (4H Chart)
According to the 4-hour chart, the Bitcoin price may head to the downside as the technical indicator Relative Strength Index (14) crosses below the 60-level. On the upside, if the Bitcoin price stays above the 9-day moving average in the short term, bullish influence could spike, and the accrued gains massively.
However, the current candle may target the support level at $16,000 and below, but the best the bulls can do is to hold the current market value of $16,912 and keep their attention on breaking the potential resistance at $18,000 and above.
Meanwhile, the Impact Token (IMPT) makes it easier for everyone to contribute to a greener and more sustainable environment. Now is a fantastic opportunity to invest in the project. The IMPT presale is ongoing, and roughly 13.5 million has been raised so far.
Nevertheless, D2T token presale is live and it has realized close to $8 million. Dash 2 Trade (D2T) is a unified analytics platform for market-beating intelligence and features to take your trading experience to the next level. Additional team members have been onboarded, and its presale dashboard beta launch is coming soon.
Related
Dash 2 Trade – High Potential Presale
Active Presale Live Now – dash2trade.com
Native Token of Crypto Signals Ecosystem
KYC Verified & Audited
Join Our Telegram channel to stay up to date on breaking news coverage


