
Crypto.com (CRO) Price: Bullish Divergence Fueling Momentum?

CRO price witnessed a nearly 20% decline last week, but there are indications of a potential bullish divergence on the weekly RSI.
The native token of trading platform, Crypto.com saw a steady decline as much of the altcoin market suffered the same fate over the past week. However, most notably, the recent shutdown announcement of its US-based office greatly affected the price performance too.
CRO Price Suffers Steep 18% Decline in Past Week
The CRO price experienced a significant drop of over 18% during the previous week. The price of CRO fell below the support zone ranging between approximately $0.0537 and $0.06.
However, Crypto.com’s token managed to close above the support at around $0.0537 by the end of the week.

Nevertheless, Cronos seems to be continuing its downtrend. The MACD has been displaying a bearish decline for several weeks, and there is a possibility of a bearish crossover in the MACD lines.
On the other hand, the RSI shows potential for a significant bullish divergence, suggesting that Cronos could target the next significant Fib resistance areas at around $0.063 and $0.071, respectively.
Bearish Signals Dominate Daily Chart
The daily chart reveals clear bearish signals. Although the RSI is in oversold regions, it does not provide any bullish indications. Furthermore, the MACD histogram continues to decline in a bearish manner, while the MACD lines have crossed in a bearish manner.
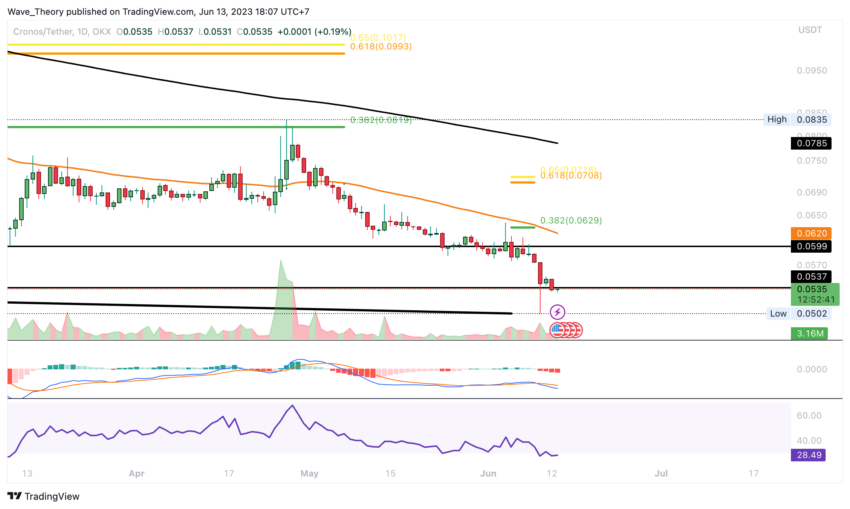
Additionally, the presence of a death cross in the EMAs confirms the bearish trend in the short to medium term. If Cronos manages to rebound, it could encounter additional resistance near $0.062 at the 50-day EMA.
4-Hour Chart Shows Death Cross
The 4-hour chart also reveals a death cross, further confirming the short-term bearish trend.
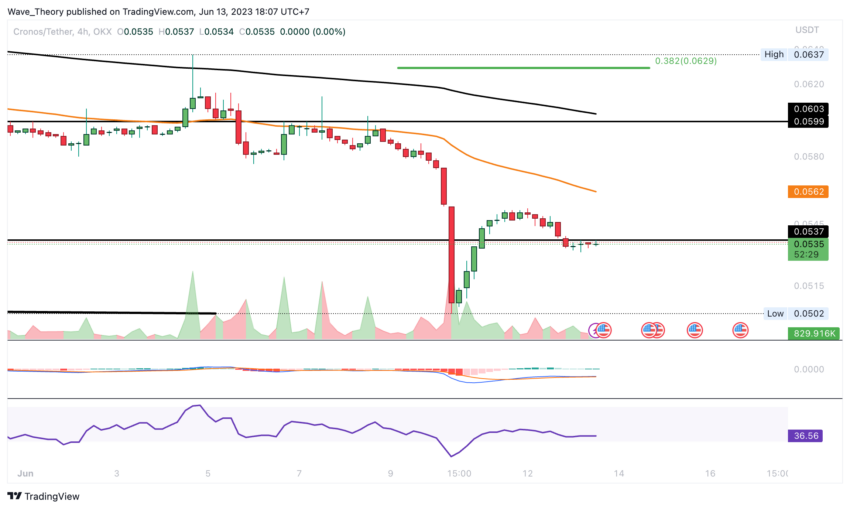
However, the MACD histogram currently exhibits bullish momentum, while the MACD lines are in close proximity and could potentially cross in either a bullish or bearish manner.
Cronos Price at Risk of a Potential Drop
If the Cronos price breaks below the current support, CRO price could retreat to its all-time low (ATL) around $0.024, indicating a potential downside of approximately 55.6%.
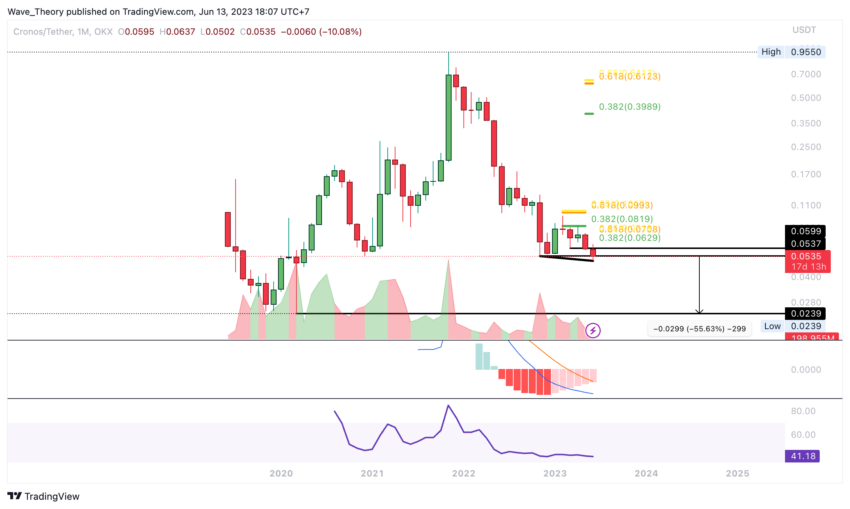
Notably, the monthly chart’s MACD histogram continues to display a bullish trend reversal, although the situation appears more bearish overall, with limited upside potential in the near term.
BTC Comparison: Cronos Price Faces Downside Risk
Against BTC, CRO continues its downward trajectory. The Crypto.com token may experience an additional 27% drop, reaching support between approximately 0.0000015 BTC and 0.0000017 BTC.
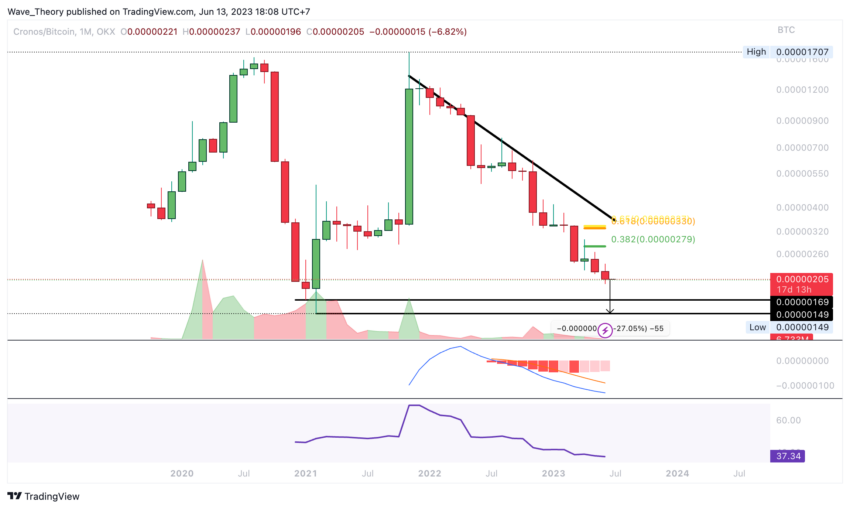
Despite this bearish outlook, the monthly chart’s MACD histogram still demonstrates a bullish inclination.
Disclaimer
In line with the Trust Project guidelines, this price analysis article is for informational purposes only and should not be considered financial or investment advice. BeInCrypto is committed to accurate, unbiased reporting, but market conditions are subject to change without notice. Always conduct your own research and consult with a professional before making any financial decisions.