Polkadot, Kusama Meet Critical Resistance

Key Takeaways
Polkadot is consolidating between $8.55 and $10.70.
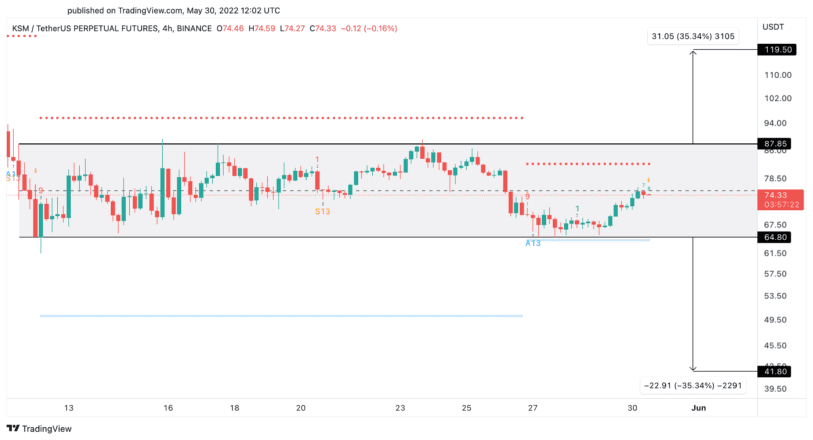
Similarly, Kusama is stuck between $64.80 and $87.85.
DOT and KSM must break support or resistance to define their directions.
Share this article
The cryptocurrency market has kicked off the week in the green, helping Polkadot and Kusama surge to critical resistance areas. Still, both assets have yet to find the catalysts they need to break out.
Polkadot, Kusama Remain Stagnant
Polkadot and Kusama are still consolidating within no-trade zones, waiting for a spike in volatility.
Polkadot has defined a clear support floor at $8.55, while a resistance barrier lies at $10.70. A decisive four-hour candlestick close outside of this range could determine where the blockchain’s DOT token will go next. The formation of a symmetrical triangle on the four-hour chart suggests that its price could move by nearly 42% upon the break of the stagnation period.
If this technical formation remains the key governing pattern driving Polkadot’s price action, a breach of the $10.70 resistance level could result in an upswing to $14.80. However, if selling pressure mounts and DOT dips below the $8.55 support, a nosedive to $5.18 could follow.
Kusama is also showing ambiguity, trading in the $64.80 to $87.85 range. A sustained four-hour close below support or above resistance could help determine where KSM will go next. However, due to ongoing uncertainty across the crypto market, KSM’s direction will likely be unclear until the trend resolves.
Moreover, Kusama appears to be forming a parallel channel on its four-hour chart. The pattern’s height suggests that a break of the $64.80 to $87.85 range could result in a 35.34% price movement.

Despite Bitcoin’s bullish price action to open the week, Polkadot and Kusama have yet to find new catalysts to help give them sufficient trading volume to break out. The price pockets both assets are currently stuck can be considered no-trade zones. Until they decisively breach their points of interest, their directions will likely remain unclear.
Disclosure: At the time of writing, the author of this piece owned BTC and ETH.
For more key market trends, subscribe to our YouTube channel and get weekly updates from our lead bitcoin analyst Nathan Batchelor.
Share this article
The information on or accessed through this website is obtained from independent sources we believe to be accurate and reliable, but Decentral Media, Inc. makes no representation or warranty as to the timeliness, completeness, or accuracy of any information on or accessed through this website. Decentral Media, Inc. is not an investment advisor. We do not give personalized investment advice or other financial advice. The information on this website is subject to change without notice. Some or all of the information on this website may become outdated, or it may be or become incomplete or inaccurate. We may, but are not obligated to, update any outdated, incomplete, or inaccurate information.
You should never make an investment decision on an ICO, IEO, or other investment based on the information on this website, and you should never interpret or otherwise rely on any of the information on this website as investment advice. We strongly recommend that you consult a licensed investment advisor or other qualified financial professional if you are seeking investment advice on an ICO, IEO, or other investment. We do not accept compensation in any form for analyzing or reporting on any ICO, IEO, cryptocurrency, currency, tokenized sales, securities, or commodities.
See full terms and conditions.


