Price analysis for BTC, ETH, MIOTA

The cryptocurrency market cap has reached $2 trillion as Bitcoin and Ethereum prices break above crucial levels
The top two cryptocurrencies by market cap started the week on a roll, reaching new multi-month records despite negative news regarding crypto tax in the US. The Bitcoin price moved from a weekly low of $40,506 to a high of $46,586, according to data from CoinGecko.
Meanwhile, Ethereum blasted through the $3k barrier after the successful implementation of the London hard fork. The price of ETH soared to highs of $3,265, with the positive market sentiment triggering similar gains for most altcoins.
IOTA’s price also saw a decent bounce, edging past $1.00 to reach nearly two-month highs of $1.10.
Moonrock Capital managing director Simon Dedic says that BTC and ETH are both gearing up for fresh upsides after a retest of critical support levels. This should also see other altcoins ride the buying pressure to continue higher.
$BTC and $ETH retracing and testing previous resistance as new support.
Now is the time to load up before we go up.
— Simon Dedic (@scoinaldo) August 12, 2021
Here is a brief price outlook for Bitcoin, Ethereum, and IOTA going into the weekend.
BTC price
BTC/USD daily chart. Source: TradingView
BTC/USD has formed a green candle on the daily chart after a Doji formation resulted in a retrace to the $43,700 zone. Bulls are currently trying to break the $46,300 barrier and success would bring the horizontal resistance at $48,858 into play. Key objectives for bulls lie at the $50k zone but moves into the $53k—$55k region are the potential targets over the next few days.
On the downside, the 20EMA ($41,732) and 50EMA ($39,063) provide robust support levels.
ETH price 
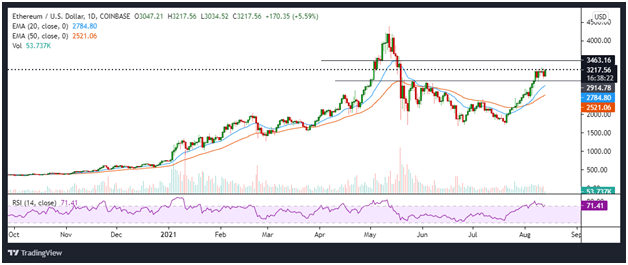
ETH/USD daily chart. Source: TradingView
ETH/USD retested the $2,915 price level but it is now looking to break higher after notching more than 5% in gains over the past 24 hours. Crypto analyst il Capo suggests ETH could rise to a high of $3,500 if BTC inches towards $50k.
On the downside, he puts support around $2.5k. The chart below shows that the 20 EMA ($2,785) and 50EMA ($2,521) offer support if bulls fail to clear $3,300.
IOTA price 
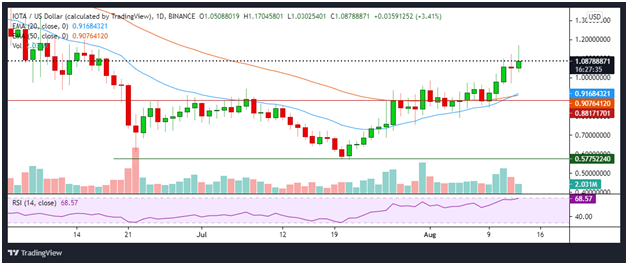
IOTA/USD daily chart. Source: TradingView
The IOTA price is in an uptrend and indecision seen on Thursday appears to be resolving in the bulls’ favour. The RSI is looking to break into the overbought territory, while the 20 EMA and 50 EMA have formed a golden cross.
Bulls have come close to $1.20, which is achievable if upside momentum holds price above $1.00. If the market flips negative, the moving averages offer strong support at around $0.92.


