Ripple’s (XRP) Daily Transactions Surges to Multi-Month Highs

The Ripple Network (XRP) witnessed a surge in adoption rate on July 8. This caused the total transaction count recorded on that day to climb to levels last observed in February.
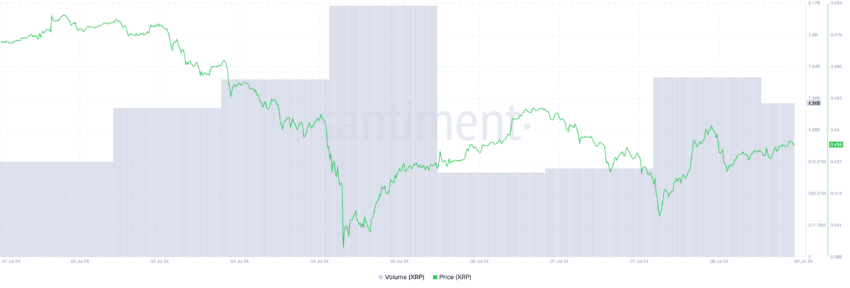
The uptick in user demand on the network also led to a rally in XRP’s trading activity. That day, the altcoin’s daily trading volume exceeded $1 billion.
Ripple Sees an Influx of Users
On-chain data show that on July 8, the number of successful transactions completed on the XRP Ledger totaled 2.3 million. This marked a 15% spike from the 2 million transactions recorded the previous day. The last time the network registered a single-day transaction count this high was on February 16.
The month has seen a remarkable surge in the demand for the decentralized public blockchain. Since July 1, the daily transaction count on the network has skyrocketed by 97%.
Yesterday’s high demand for the XRP Ledger positively impacted XRP’s performance. Its daily trading volume totaled $1.5 billion. XRP trades at $0.43 at press time, rising by almost 5% in the past 24 hours. During the same period, its trading volume has also increased by 23%.
Read More: How To Buy XRP and Everything You Need To Know

When an asset’s price and trading volume increase, it’s generally seen as a bullish sign. It signals that more buyers are entering the market, potentially pushing the price even higher.
XRP Price Prediction: Do Not Get Carried Away
Despite the surge in activity in the XRP market in the past 24 hours, the bearish sentiments against the altcoin remain significant.
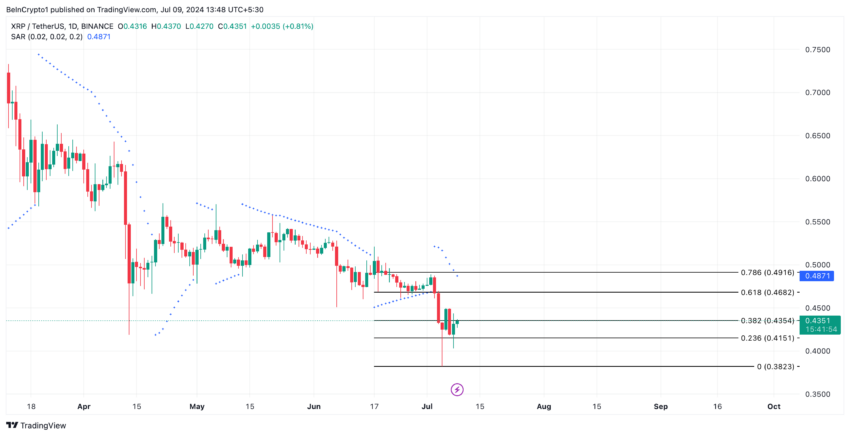
While XRP’s price might have witnessed a minor uptick in the past 24 hours, it is poised to maintain its month-long downtrend. At its current price, the altcoin’s price has plummeted by 12% in the past 30 days.
At press time, the dots of XRP’s Parabolic Stop and Reverse (SAR) indicator lie above its price. This indicator identifies potential trend direction and reversals.
The market is declining when this indicator’s dots rest above an asset’s price. It indicates that the asset’s price has been falling and may continue to do so.
If this decline continues, XRP’s value may plummet to $0.41.
Read More: Ripple (XRP) Price Prediction 2024/2025/2030

However, if daily trading volume and demand continue to rise, XRP’s price could surge towards $0.46.
Disclaimer
In line with the Trust Project guidelines, this price analysis article is for informational purposes only and should not be considered financial or investment advice. BeInCrypto is committed to accurate, unbiased reporting, but market conditions are subject to change without notice. Always conduct your own research and consult with a professional before making any financial decisions. Please note that our Terms and Conditions, Privacy Policy, and Disclaimers have been updated.


